Arctic Review
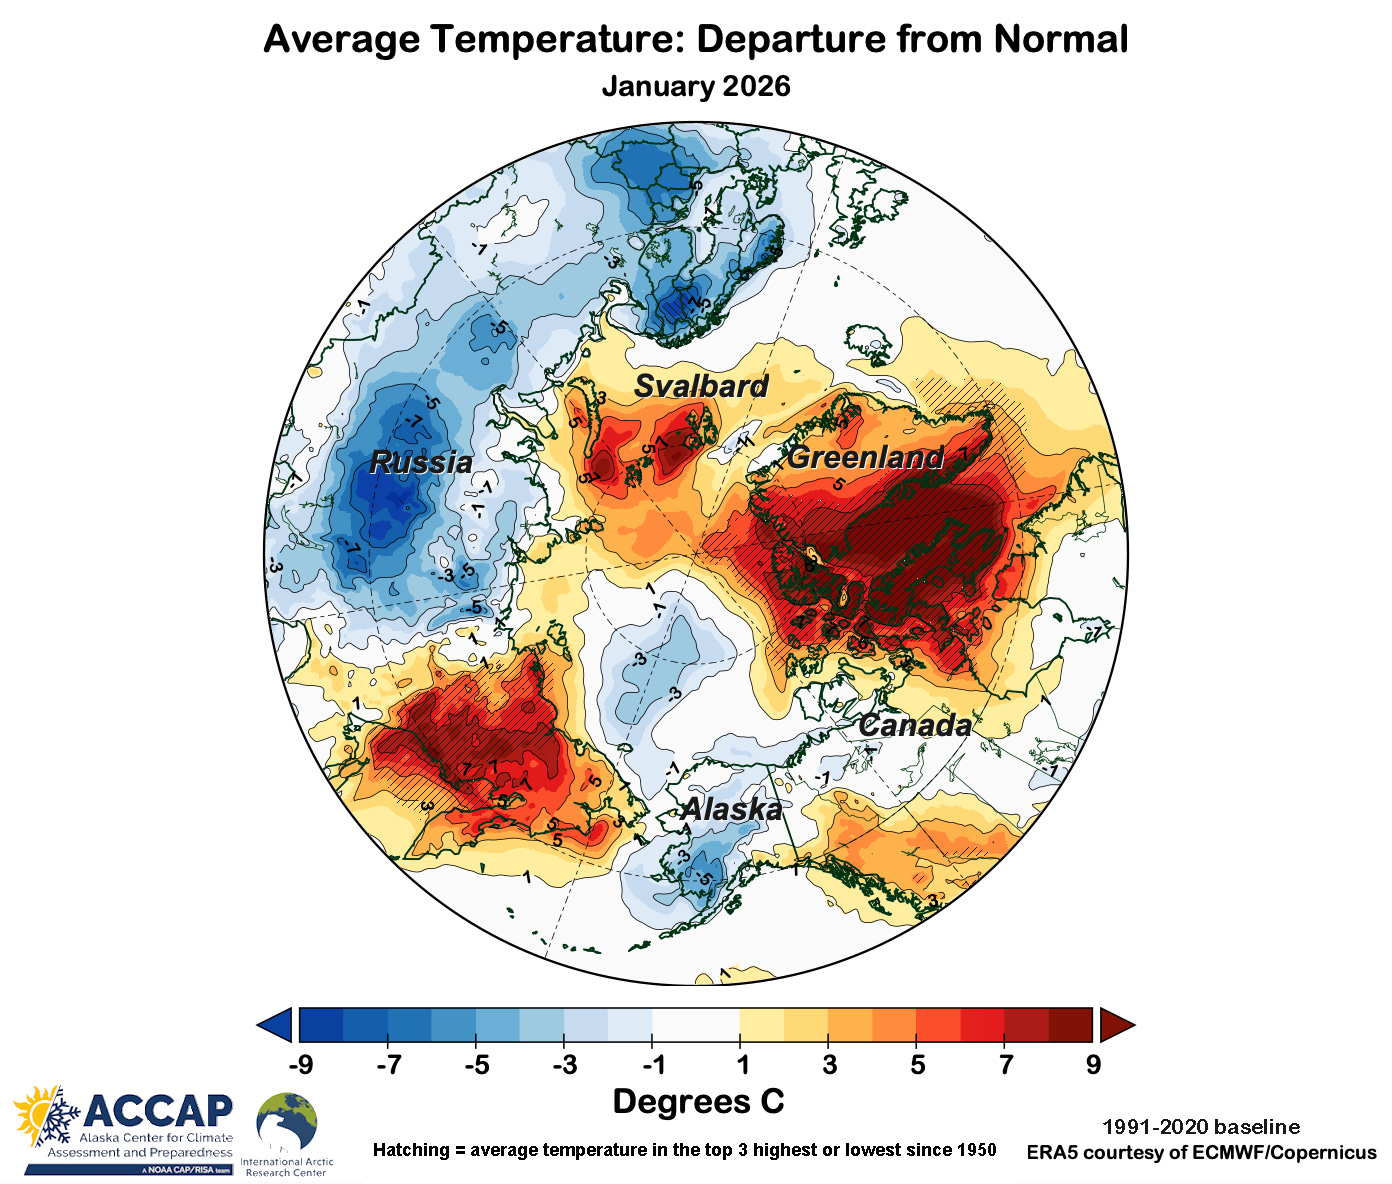
January 2026 temperature departures from the 1991-2020 baseline around the Arctic showed notable cold and mild areas, though of course there was a much larger area above normal than below. Most outstanding was the extreme warmth (relative to normal) over the western Atlantic Arctic. Both Greenland and Nunavut, Canada had the highest average temperature of any January since 1950 based on ERA5 reanalysis. In the Eurasian Arctic, most continental areas were colder than normal, especially the northern Nordic Arctic and central Siberia. However, the eastern quarter of Russian Arctic was very mild, with Magadan Oblast (north and northwest of the Sea of Okhotsk) having the second mildest January since 1950.
Interestingly, nearly a third of Arctic lands saw average temperatures more than 5°C different from normal: 9 percent of the land more than 5°C below normal and 24 percent more than 5°C above normal.
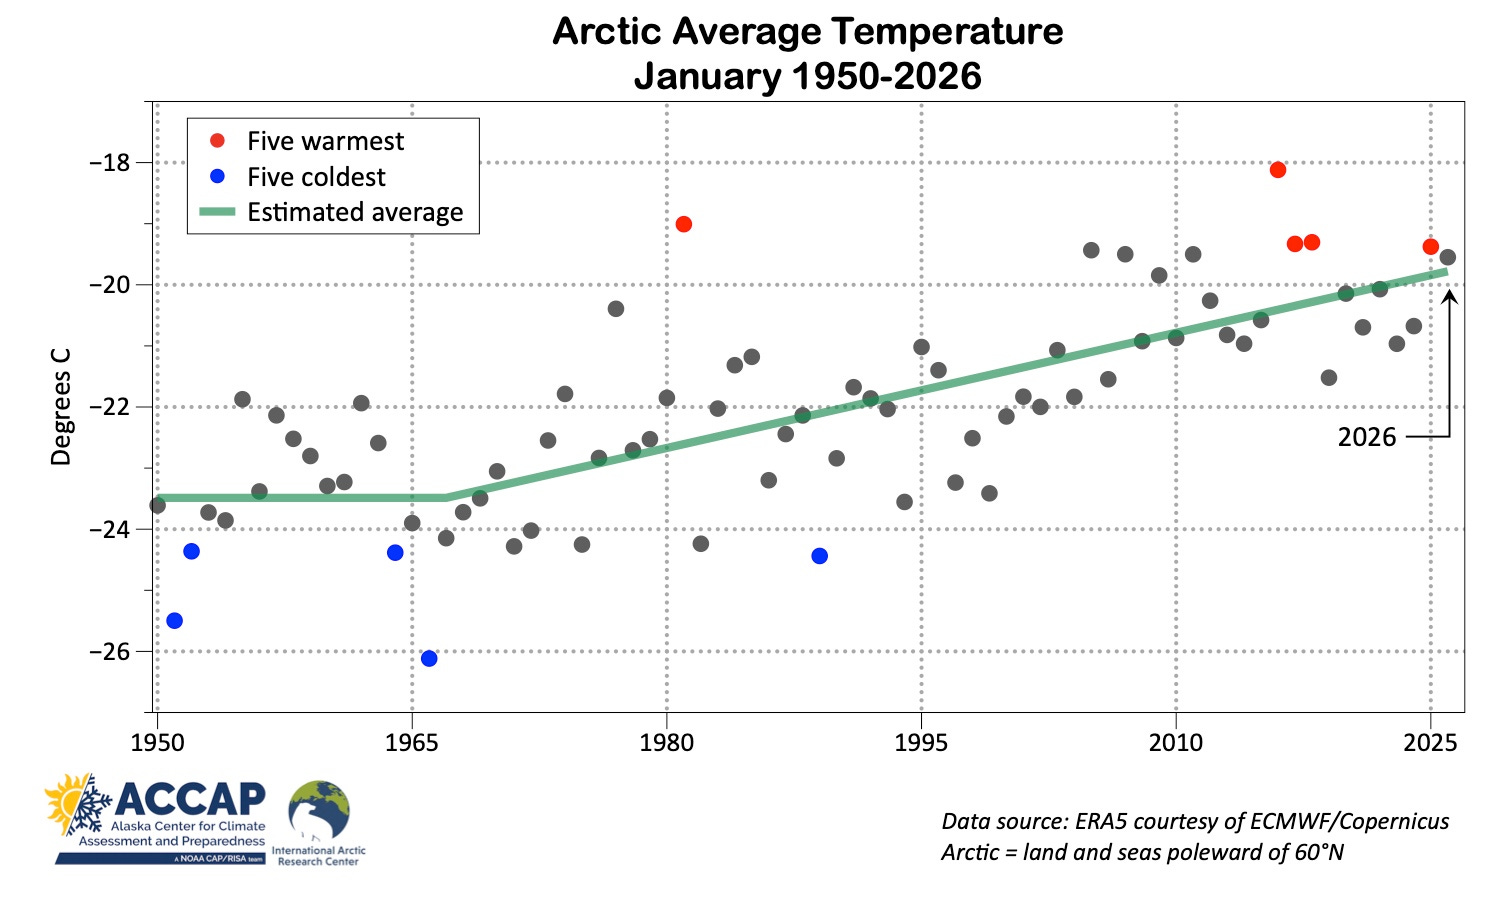
For the Arctic overall, January was very slightly colder than last year and the ninth warmest since 1950 in ERA5 reanalysis (Fig. 2). January for the Arctic is now typically about 4°C warmer than it was prior to 1970. Overall for Arctic lands, January 2026 ranked as the 13th mildest since 1950, with 2021, 2023 and 2024 all colder.
Precipitation
January precipitation was below the 1991-2020 baseline normal over 57 percent of the Arctic. The Atlantic Arctic from Greenland eastward was strikingly dry, with Norway having the lowest January precipitation since 1950 and both Finland and Iceland having the fourth lowest total. Below normal totals were widespread in the central and Russian Arctic and western Alaska. In contrast, Nunavut had the highest January precipitation since 1977 and Northwest Territories, Canada had the second highest January total since 1950.
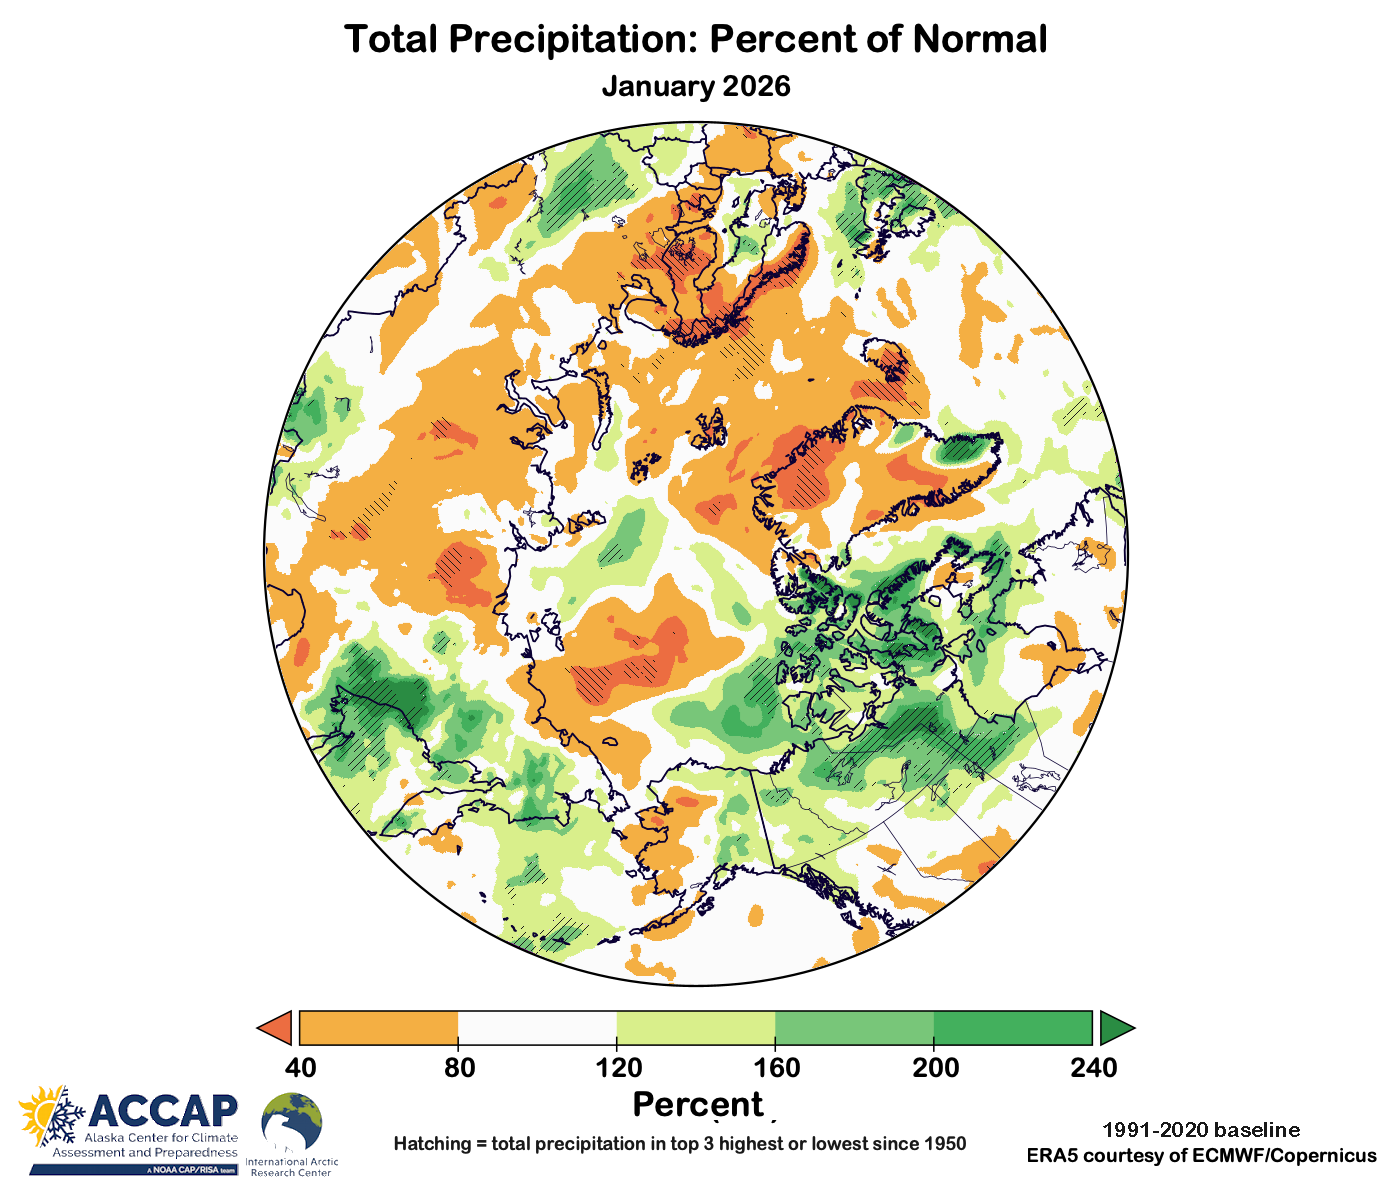
Arctic-wide total precipitation in January was only 89 percent of the 1991-2020 baseline average and was the lowest for the month since 2004.
Sea ice
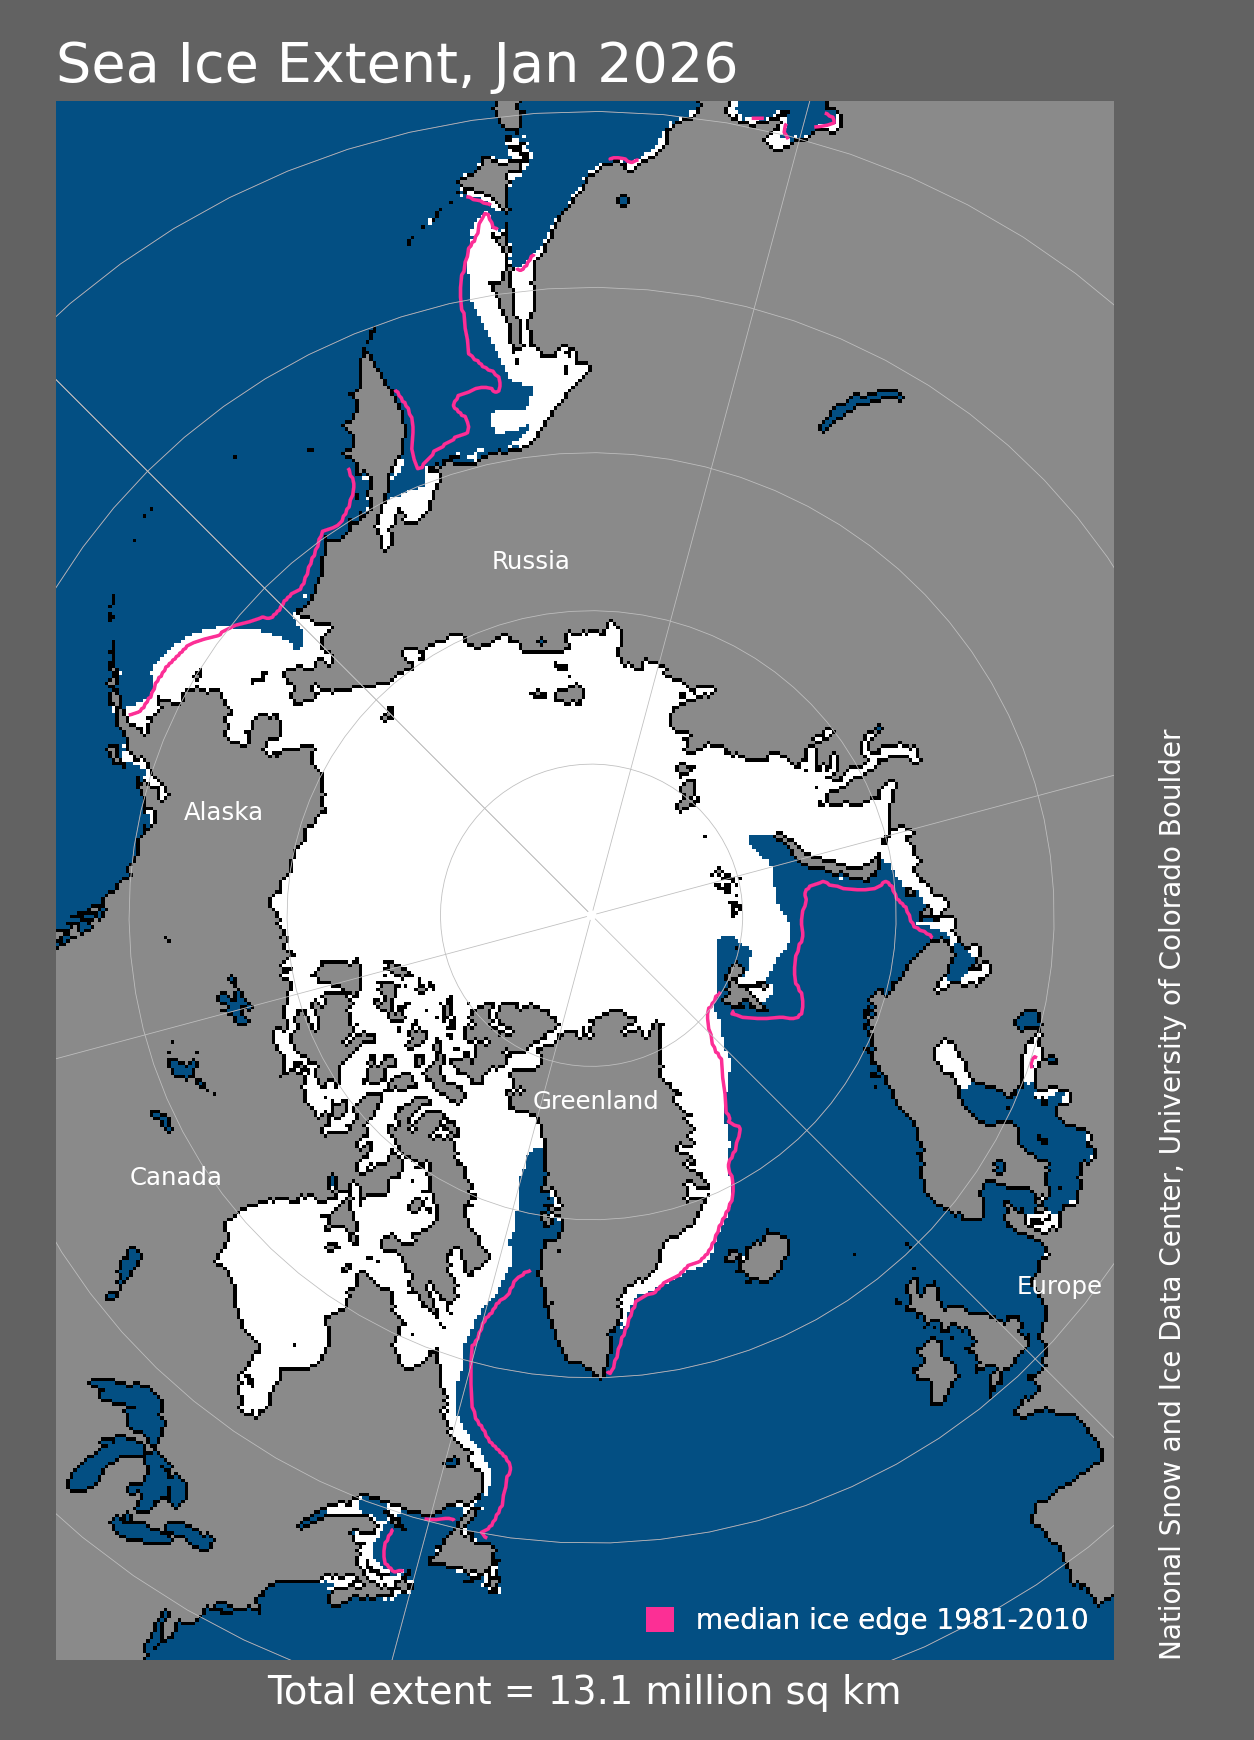
Regionally, sea ice extent was below average in marginal seas on both the Atlantic and Pacific sides of the North Pole (Fig. 4), but especially Baffin Bay (between Greenland and Canada) with the second lowest January extent since 1979, and the Sea of Okhotsk (eastern Russian) at third lowest.
Following record low ice extent in December, Arctic-wide sea ice extent in January did not recover much, at least relative to normal. Overall, the January average daily extent was tied for second lowest in January in the National Snow and Ice Data Center (NSIDC) analysis and third lowest in the EUMETSAT OSI SAF and Japanese Aerospace Exploration Agency (JAXA) analyses (all since 1979).
Alaska Review
Temperatures
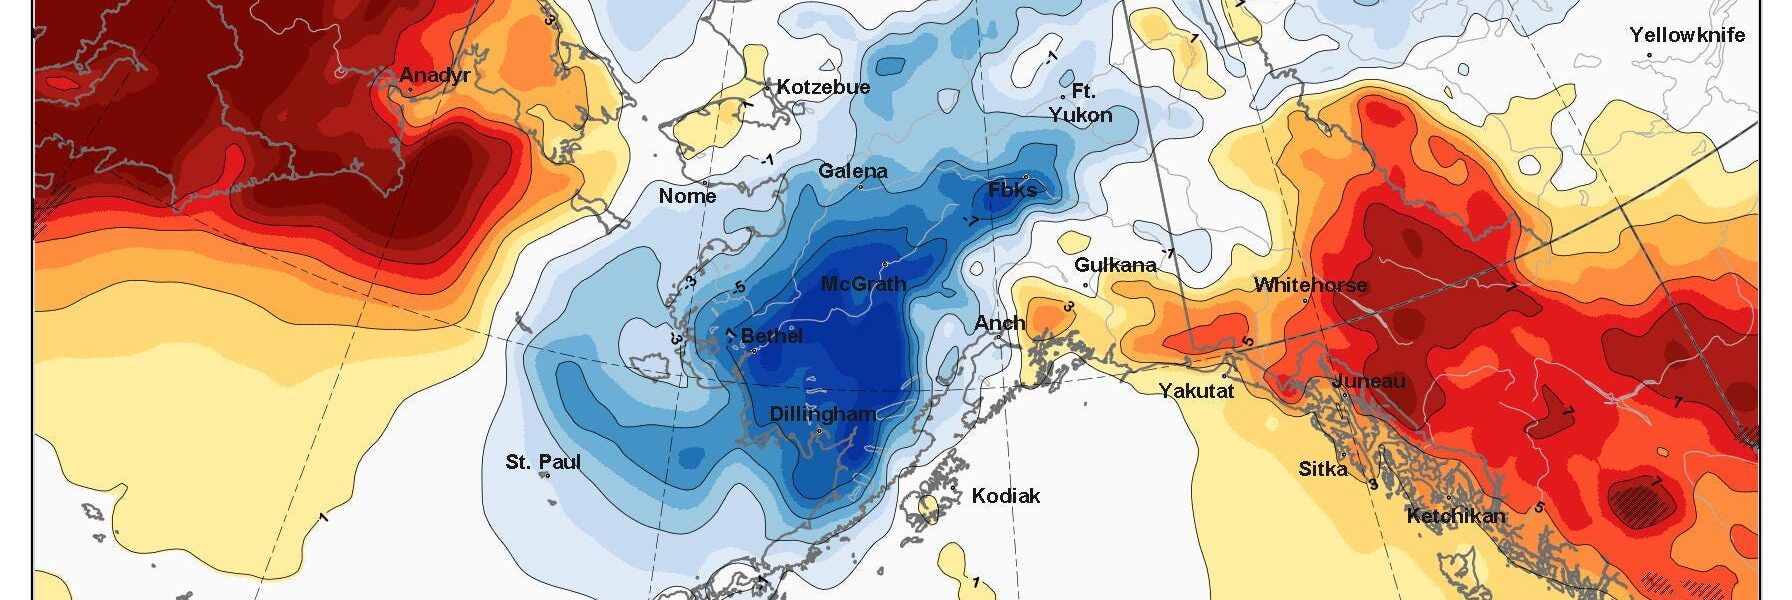
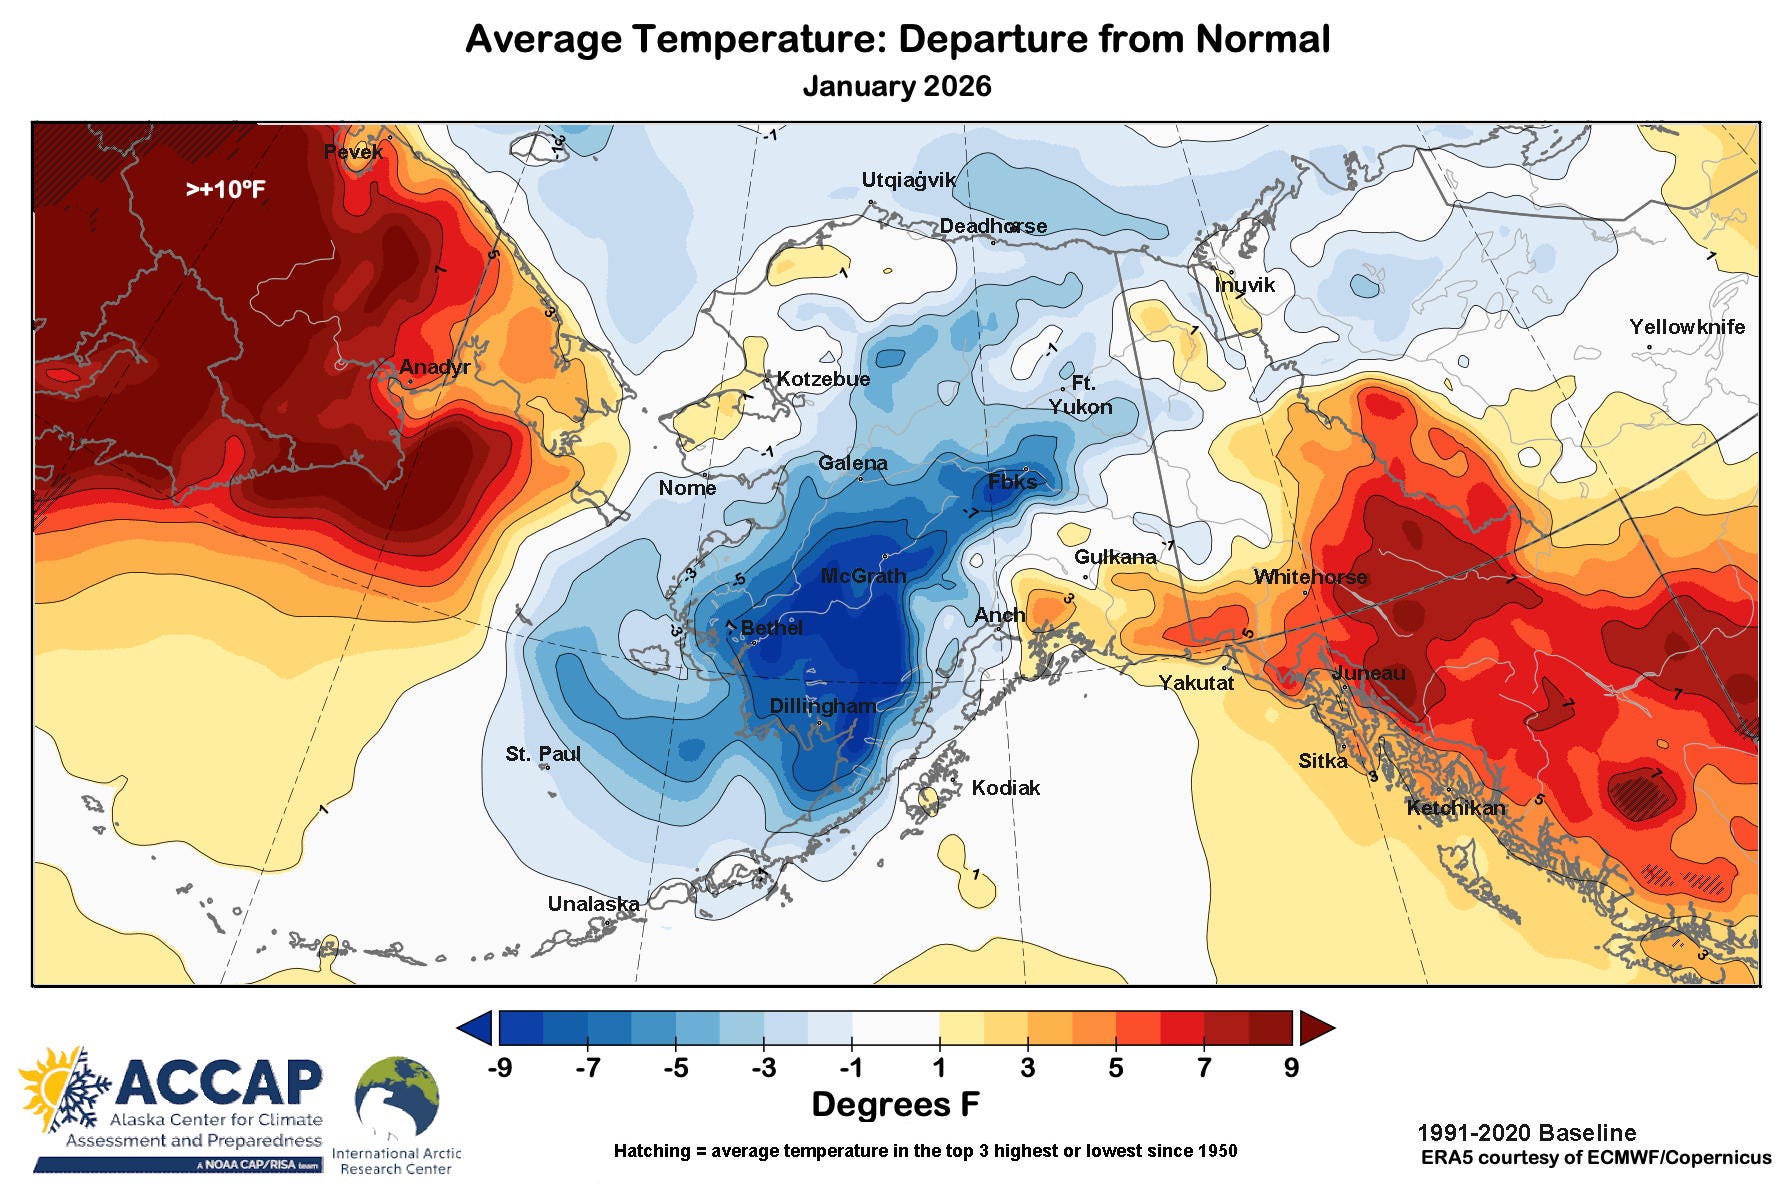
January in Alaska saw significant regional differences in overall temperatures relative to the long term average (Fig 5a). Southeast Alaska and the Gulf of Alaska coast from Prince William Sound eastward were mild for the month overall, although it was not nearly as mild as January 2025. Southwest Alaska and most of the western and and central Interior were colder than normal, though January 2020 was significantly colder. As in December, there was a marked west-to-east gradient in the Bering Strait region. Across most of mainland Alaska there was a sharp contrast between the first half of the month (my recap of the December-January cold snap is here), with the statewide average temperature 16°F below normal, and the second half of the month, which averaged 9.6°F above normal.
The ERA5 statewide average temperature was about 2.5°F below normal, making this the coldest January since 2020. The lowest temperatures in the December-January cold snap over mainland Alaska occurred during the first half of the month, with the statewide lows of -63F at Chicken and Tok on the 4th, while Fairbanks started off 2026 with significant ice fog and, at the airport, four straight days with temperatures stuck between -41F and -50F. The highest Alaska temperature in January was 57F at Klawock on the 13th.
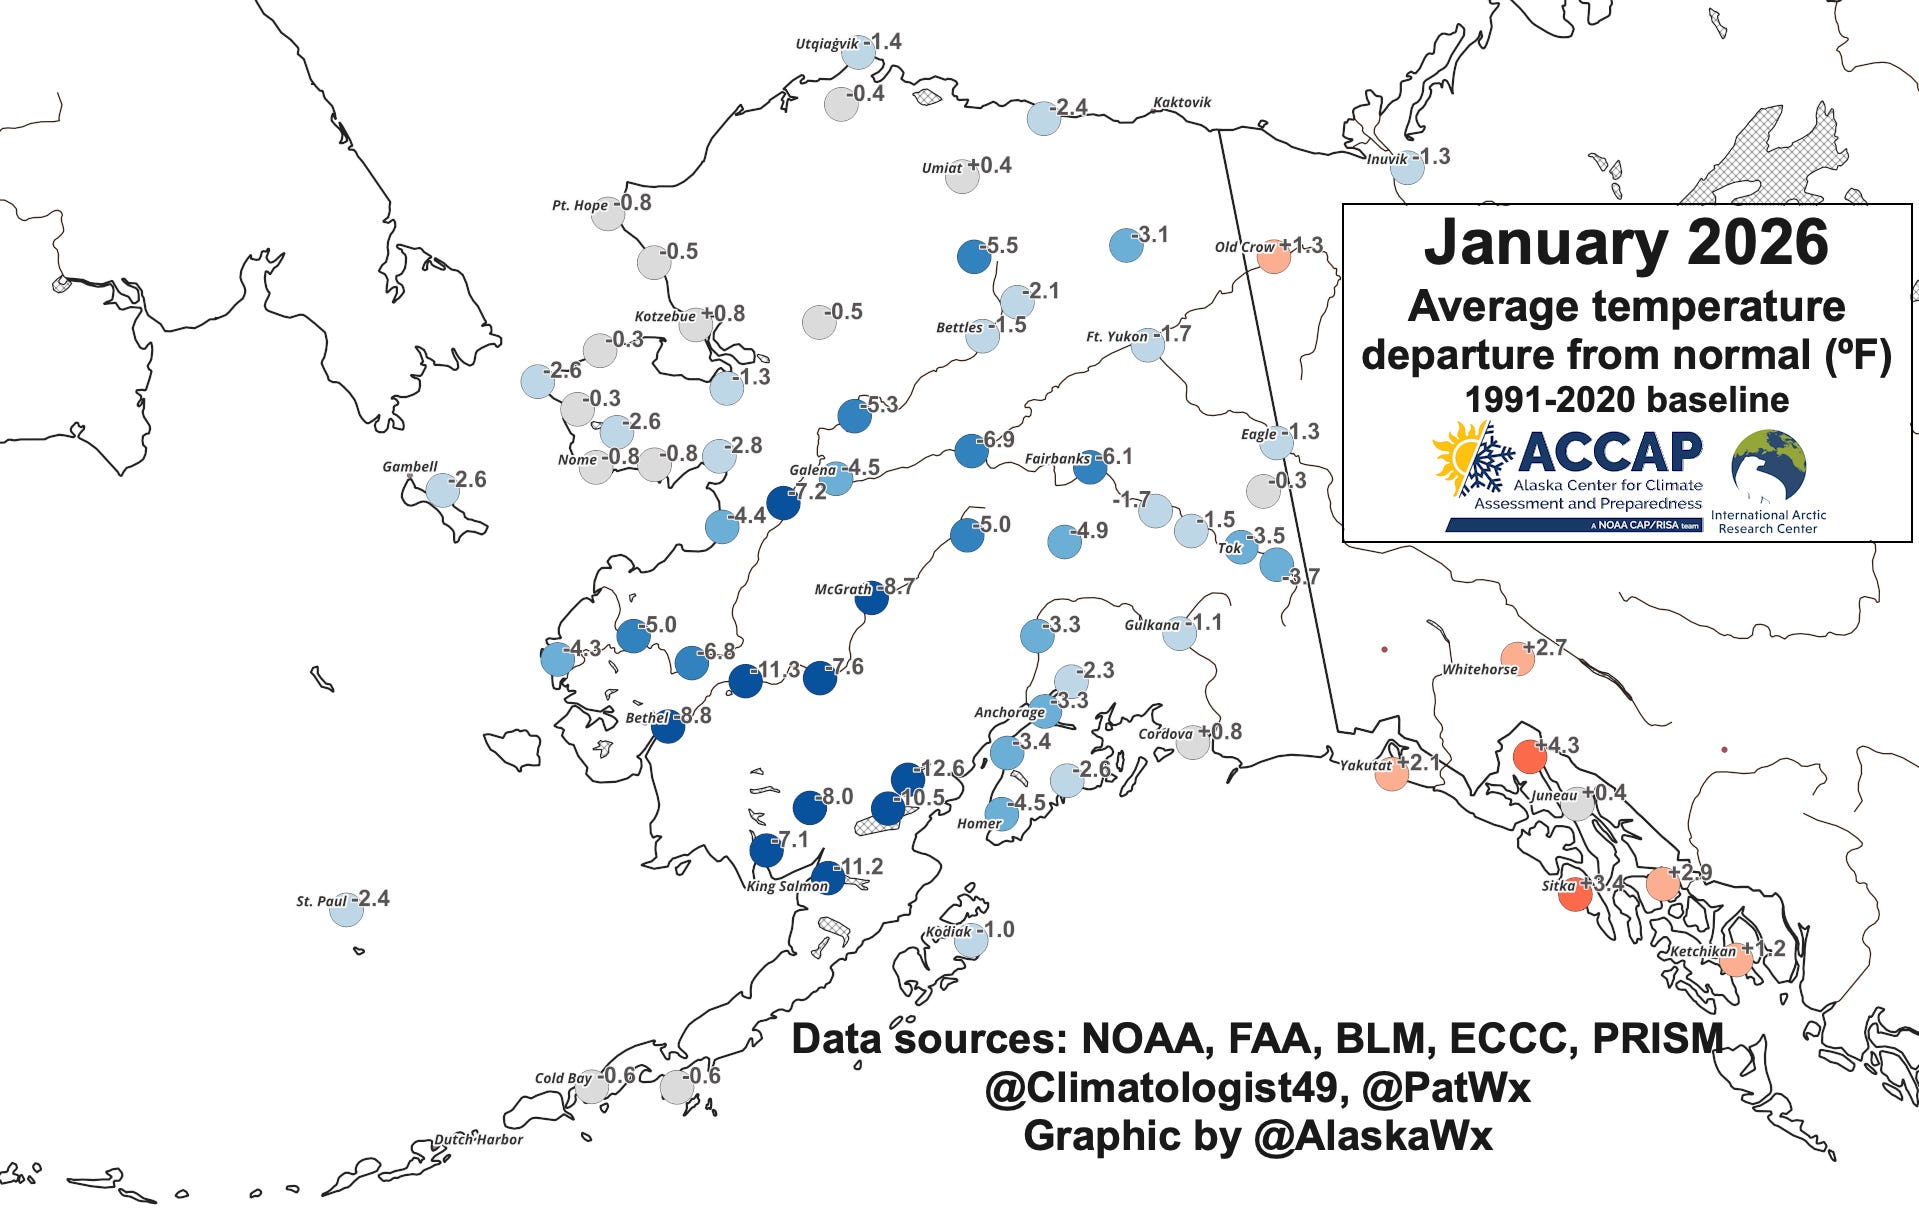
Site specific observations (Fig. 5b) follow the same pattern as in the ERA5 reanalysis. While temperatures broadly averaged 5°F to 12°F below normal in the lower Kuskokwim valley and the upper Bristol Bay region, January 2020 was substantially colder in these regions.
Precipitation
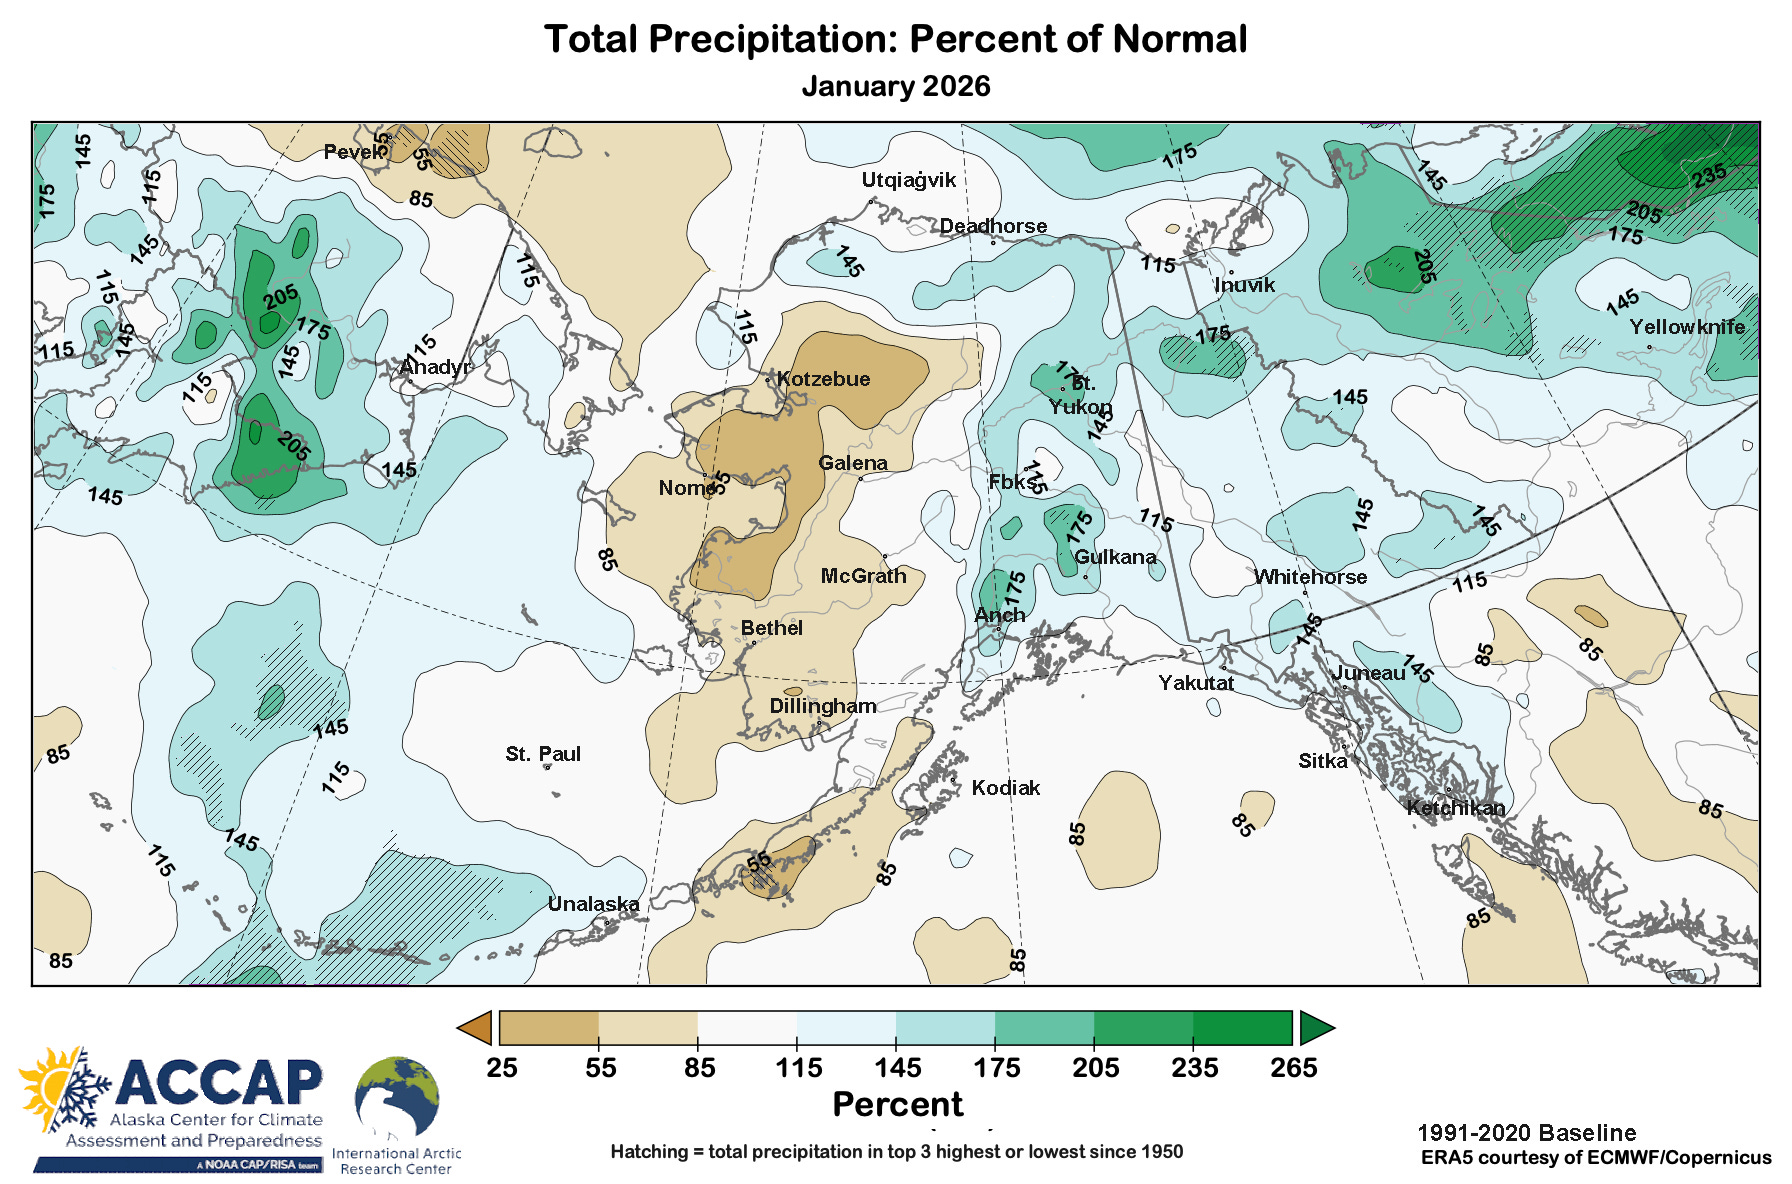
Alaska precipitation relative to normal for January was geographically split, with western Alaska generally drier than normal (except for the Aleutians) while the eastern mainland and Southeast had mostly with above normal totals. For the state as a whole, precipitation was quite close to average.
Snow pack
Snow pack at the end of January was widely below normal in ERA5 Land reanalysis across western Alaska, with the most significant departures in Northwest Arctic Borough and the eastern Seward Peninsula and eastern Norton Sound regions. Snow pack was above normal on parts of the North Slope and eastern Interior, as well as small areas in the Kuskokwim delta region and parts of upper Bristol Bay.
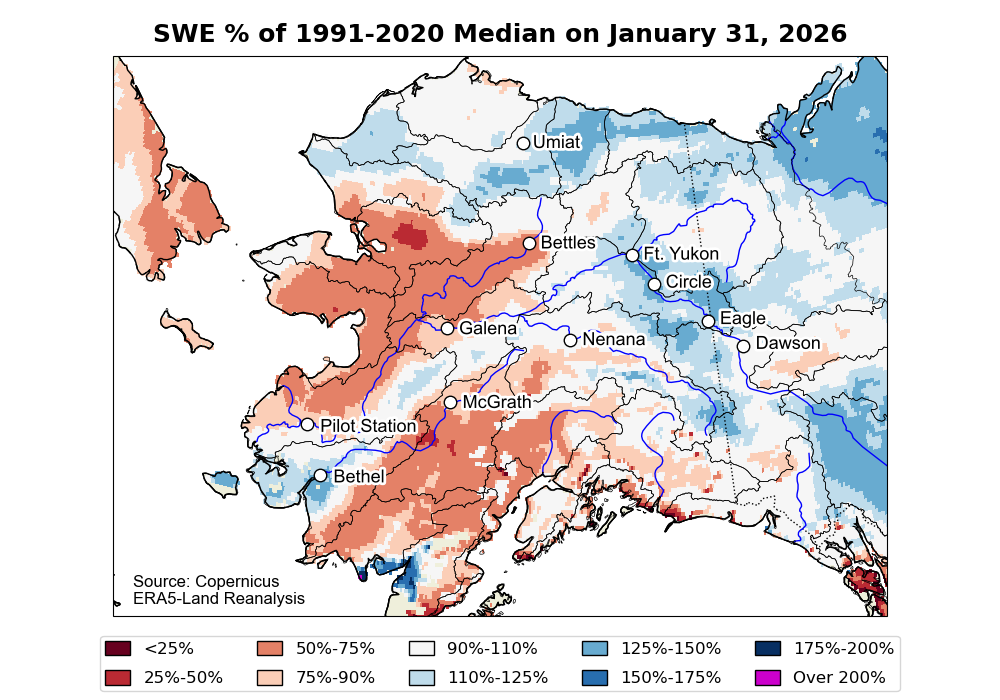
As happens nearly every winter, there was dramatic variability in late January snow pack in Southcentral, as documented by the Natural Resources Conservation Service’s Snow Survey report for February 01, here. Measured snow water equivalents ranged from well above normal in low-elevation Anchorage, where the airport had the highest January snow total on record at 40.2 inches to, well below normal in the Talkeetna Mountains and southeast of Girdwood.
Technical details and underlying data sources
As usual in this newsletter, Arctic means “poleward of 60°N” except for sea ice, where all northern hemisphere ice is included.
ERA5 monthly temperature, precipitation and snow pack snow water equivalent data is available through the Copernicus Climate Data Store, here.
Code by B. Brettschneider/NWS Alaska Region allowing rapid ERA5 regional analysis is invaluable for my work.
Site-specific Alaska climate statistics and factoids from NOAA Regional Climate Center’s ACIS website here. Monthly temperature departures from normal use the published NOAA/NCEI 1991-2020 values wherever available. Where there are no published 1991-2020 normals, e.g. at most FAA airport stations for temperatures, normals were extracted from the 1981-2010 PRISM data (Oregon State University) and then estimated for 1991-2020 baseline period. All PRISM derived normals courtesy B. Brettschneider.
The Natural Resources Conservation Service’s Snow Survey Report is released February through May each year. The current and past survey reports are available fro the Alaska Snow Survey webpage, here.
Source – https://alaskaclimate.substack.com/p/january-2026-arctic-and-alaska-climate