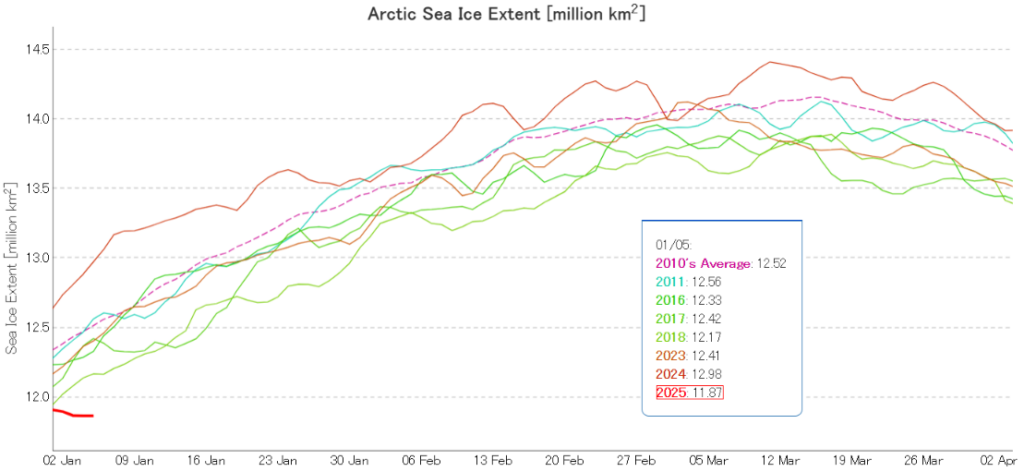
The New Year began with JAXA/ViSHOP extent lowest for the date in the satellite era, just below 2018 . Since then extent has reduced, and there is now a large gap:

The primary reason for this is the remaining open water in Hudson Bay:
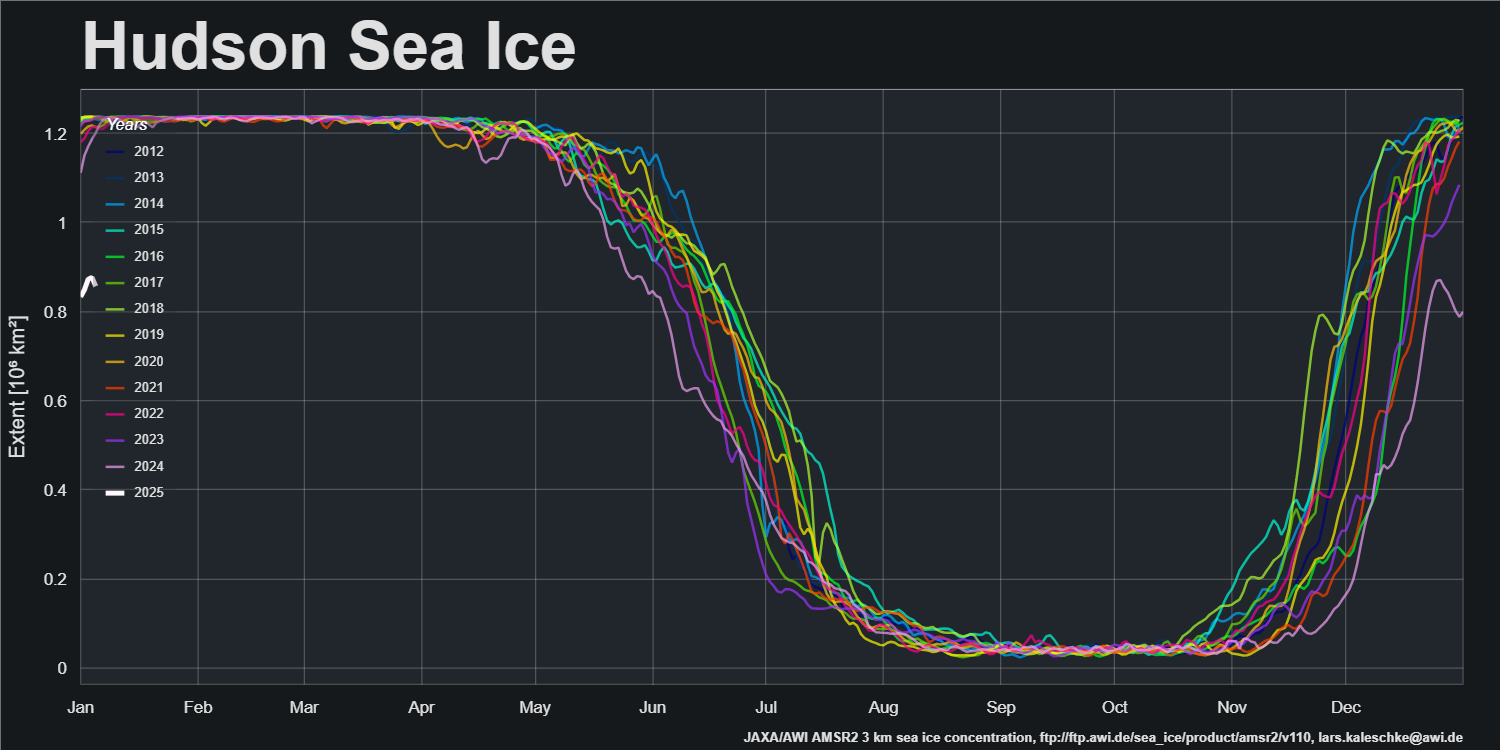
In previous years Hudson Bay has been covered by sea ice by this time of year, but in 2025 a large area remains unfrozen in early January!
Due to the way PIOMAS handles the leap years the last gridded thickness data of 2024 is dated December 30th:
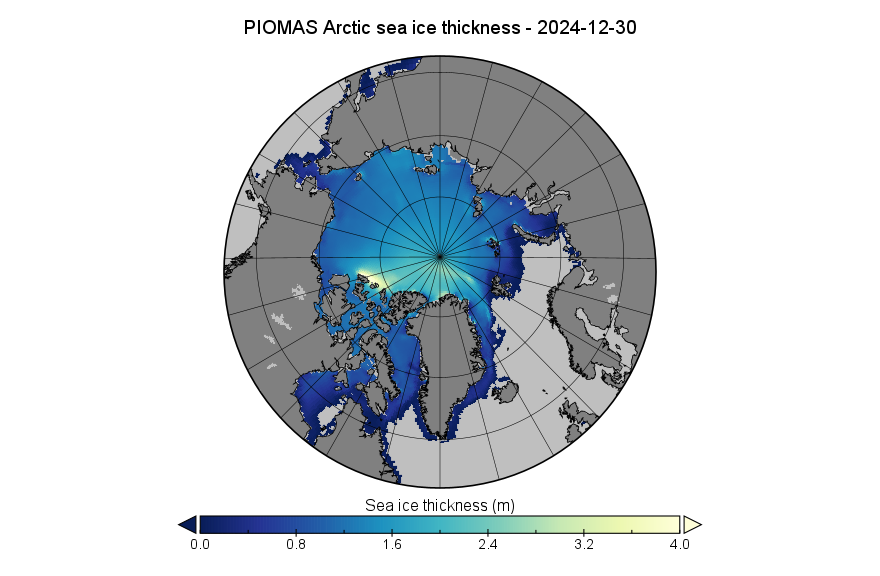
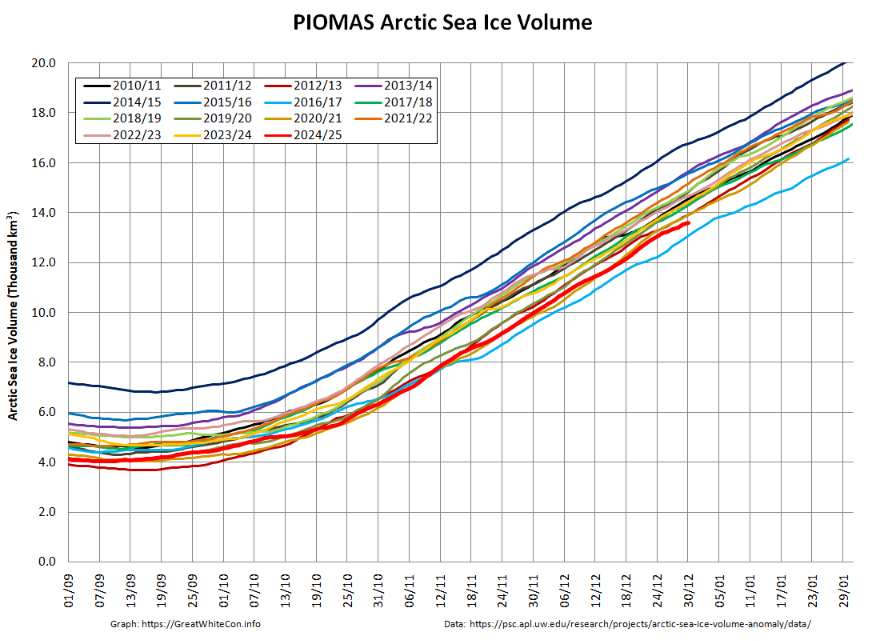
By December 30th Arctic sea ice volume had increased to 13.61 thousand km³, 2nd lowest for the date in the PIOMAS record:
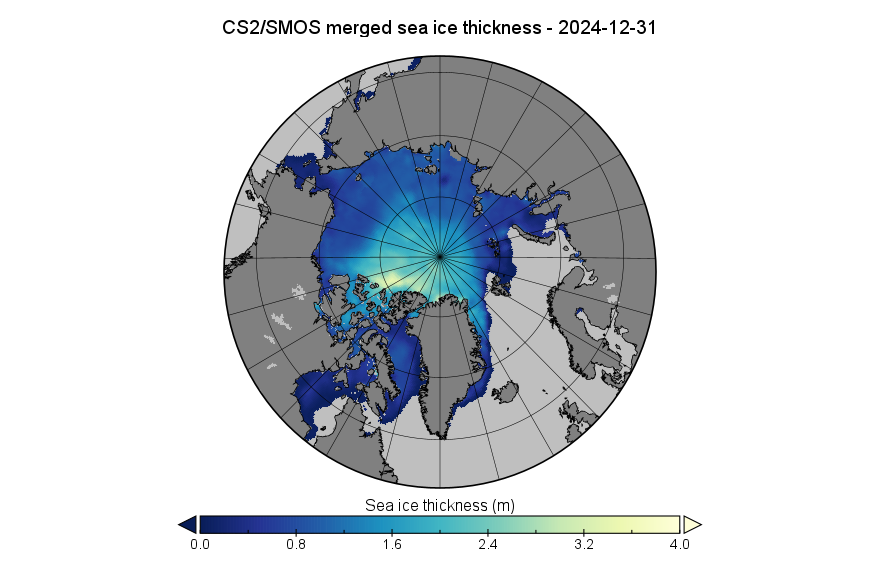
The “near real time” CryoSat-2/SMOS merged thickness data from the Alfred Wegener Institute reveals a larger area of thick ice north of the Canadian Arctic Archipelago, whilst PIOMAS shows thicker ice along the coasts of the islands:
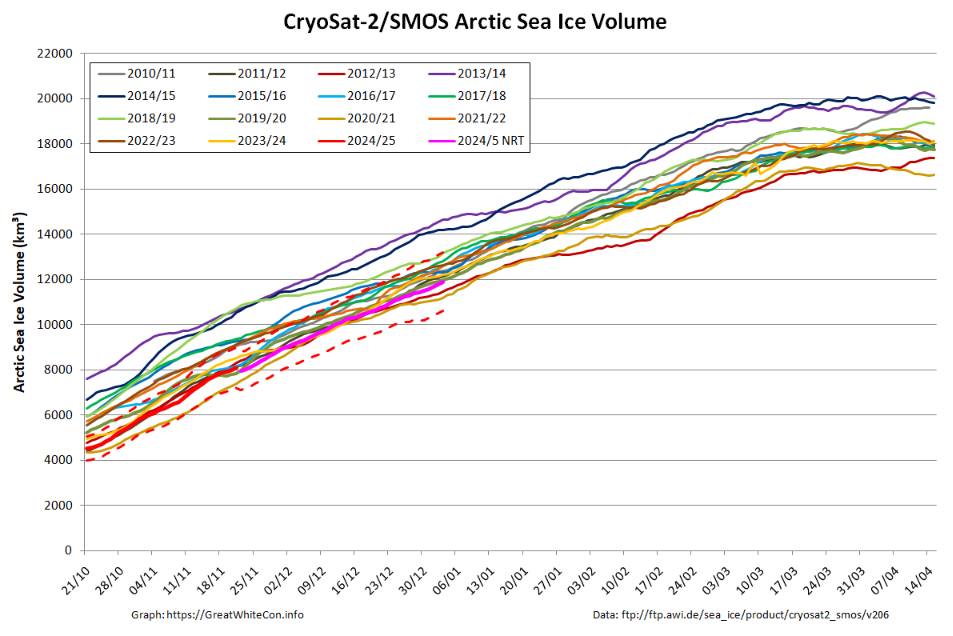
CryoSat-2/SMOS volume is currently 3rd lowest for the date, but likely to be revised upwards when the reanalysed data is released:
The DMI modelled Arctic sea ice volume December monthly graph continues to show Arctic sea ice volume lowest for the time of year:

Watch this space!