Abstract
Diminishing Arctic sea ice has led to enhanced evaporation from the Arctic marginal seas (AMS), which is expected to alter precipitation over land. In this work, AMS evaporation is numerically tracked to quantify its contribution to cold-season (October–March) precipitation over land in the Northern Hemisphere during 1980–2021. Results show a significant 32% increase in AMS moisture contribution to land precipitation, corresponding to a 16% increase per million square km loss of sea ice area.
Especially over the high-latitude land, despite the fractional contribution of AMS to precipitation being relatively low (8%), the augmented AMS evaporation contributed disproportionately (42%) to the observed upward trend in precipitation. Notably, northern East Siberia exhibited a substantial rise in both the amount and fraction of extreme snowfall sourced from the AMS. Our findings underscore the importance of the progressively ice-free Arctic as an important contributor to the escalating levels of cold-season precipitation and snowfall over northern high-latitude land.
Introduction
Arctic sea ice plays a key role in the global climate and hydrological cycle by regulating the surface energy and water balances1. The notable decline in satellite-observed Arctic sea ice cover has garnered significant attention due to its potential implications for the global hydrological cycle and extreme climate events2,3,4,5,6,7,8.
The evolution from an ice-covered to an ice-free ocean directly influences the near-surface conditions in the vicinity of the Arctic. Loss of sea ice removes the barrier to evaporation, resulting in the generation of moister air masses that carry a greater fraction of moisture derived from the Arctic9,10,11,12. Simultaneously, the presence of open water is more conducive to upward heat fluxes, warming the troposphere and enhancing its capacity to retain water vapor. The cascading effects on cloud cover and atmospheric static stability13,14 thereby may affect the nearby precipitation.
Furthermore, previous studies have linked delayed and remote precipitation responses in the mid-latitudes to changes in large-scale atmospheric circulation patterns induced by Arctic sea ice loss15,16,17,18. These studies addressed changes in dynamical processes, including the increased incidence of winter blockings19, the negative phase of the Arctic Oscillation or similar pressure anomalies20, and the joint modulation of the stratosphere polar vortex21, but paid limited attention to moisture linkages.
The growing importance of Arctic evaporation in driving changes in precipitation has attracted increased attention in recent years. The projected increase in the climatological mean Arctic precipitation is dominated by the heightened local evaporation rather than the increased poleward moisture transport9. Arctic evaporation increased nearly three times faster than its precipitation, causing an intensification of Arctic precipitation recycling11. The additional evaporation originating from the increasingly open surface has led to a shift in Arctic precipitation from being dominated by remote sources to being more locally driven.
However, few studies have focused on how increased evaporation from the progressively ice-free Arctic sustained remote precipitation from the perspective of moisture cycling and balance. Where and to what extent the increased moisture originating from the changing Arctic has contributed to land precipitation also remains unclear.
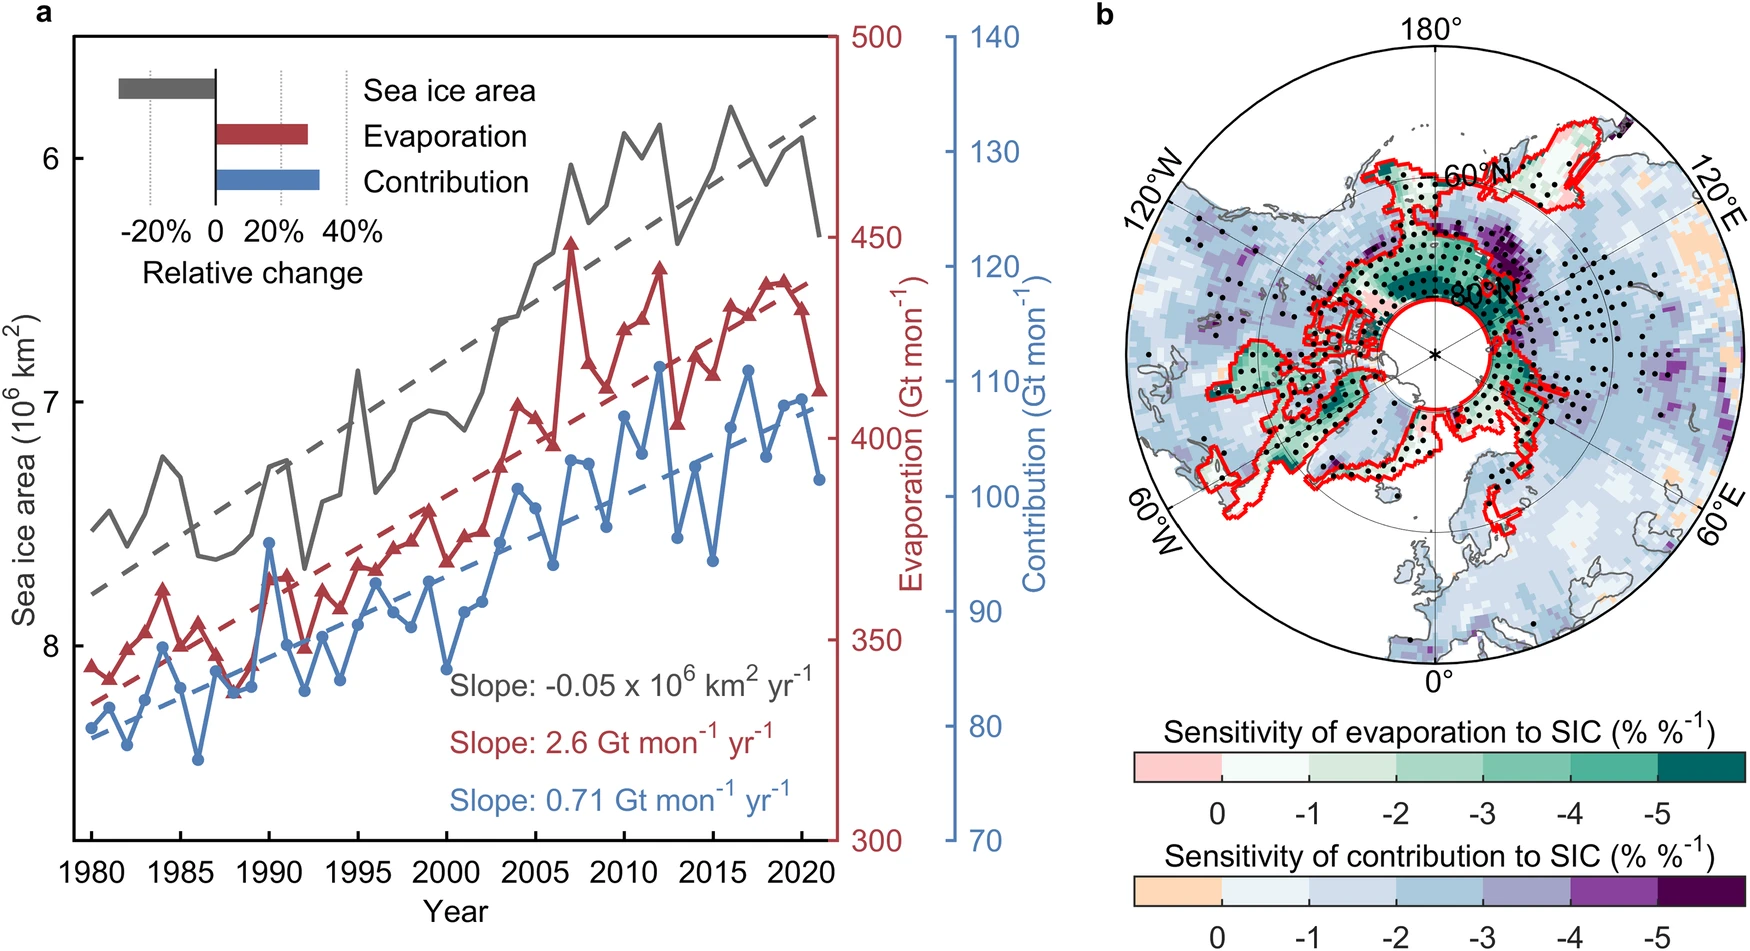
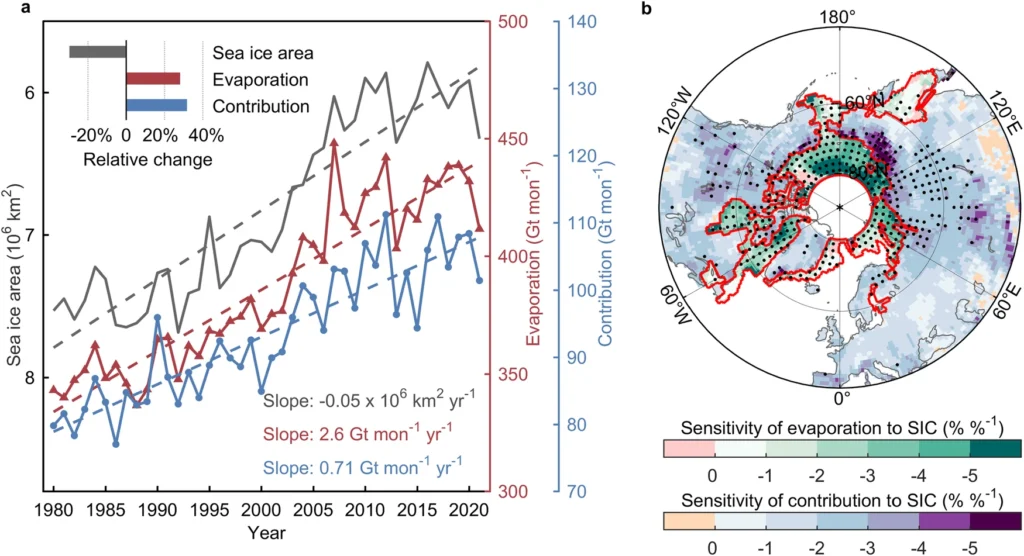
This study focuses on the increased moisture from the Arctic marginal seas (AMS), defined as the maximum extent of sea ice coverage south of 80° N during the 1980–2021 cold seasons (October–March, Fig. 1b) where the evaporation was significantly influenced by the extensive retreat of seasonal sea ice (Fig. 1a). We aimed to investigate the role of the increasing moisture supply from the AMS owing to sea-ice loss in driving changes in land precipitation over the Northern Hemisphere (NH) in the cold season, with a particular focus on extreme snowfall.
The AMS evaporation was tracked numerically by a Eulerian model (see Methods) to quantify the AMS-sourced precipitation falling on land areas. Owing to the requirement for four-dimensional, high-resolution data and the lack of sufficient observations at high latitudes, we used a reanalysis product as the input for the model. By quantifying changes in the absolute amount and fractional AMS-sourced land precipitation, the physical linkages between the sea-ice loss and land precipitation changes were quantified based on the AMS moisture contribution.
Results
Sensitivity of AMS moisture to the diminished sea ice cover
Sea ice area covered within the AMS range was extracted and analyzed statistically on a large regional scale (Fig. 1a). From 1980 to 2021, the cold-season sea ice area in the AMS has been shrinking at a significant rate of −0.05 × 10⁶ km2 yr−1 (R2 = 0.85, p < 0.05), indicating a 30% decline relative to its average area of 6.8 ×10⁶ km2. Throughout the period, the long-term trend of AMS evaporation was positive at a rate of 2.6 Gt mon−1 yr−1 (R2 = 0.86, p < 0.05), resulting in an estimated 28% increase relative to its climatological mean.
According to the moisture tracking analysis, more evaporated moisture significantly enhanced the AMS moisture contribution to the total cold-season precipitation over all land in the NH with a rate of 0.7 Gt mon−1 yr−1 (R2 = 0.80, p < 0.05). This change implies a relative increase of 32% in AMS moisture contribution over NH land.
The strong negative correlation (r = -0.95, p < 0.05) between the sea ice area and evaporation indicates a 14% increase in total AMS evaporation (54.0 Gt mon−1) per million km2 loss of sea ice. The rapidly increasing evaporation induced by changes in sea ice would regulate the AMS moisture contribution to land precipitation. Consequently, the AMS-sourced land precipitation over the entire NH was associated with a 16% increase (14.7 Gt mon−1) per million km2 loss of sea ice.
The responses of AMS moisture to changes in monthly sea ice concentration (SIC) were analyzed spatially at the grid scale (Fig. 1b). The sensitivity of AMS evaporation to local SIC was estimated within the AMS boundaries. The strong negative relationship between generally increasing evaporation and decreasing SIC was evident across nearly the entire AMS. Also apparent is the spatially varying response of localized AMS evaporation induced by the uneven loss of SIC. A high sensitivity was particularly prominent in the seas north of Eurasia, such as the Laptev and East Siberian Seas, where every 1% of SIC decline was accompanied by a more than 5% increase in local evaporation.
Over land areas, the sensitivity was reflected by the correlation between AMS-sourced precipitation in each grid box and the mean SIC within the AMS. Dotted areas over Canada and Russia indicate a strong (r < -0.5) and statistically significant (p < 0.05) negative correlation between the AMS-sourced land precipitation and the SIC across the AMS. The AMS-sourced precipitation over the northernmost regions of Siberia, especially the low-altitude coastal areas along the Laptev Sea shown as the dark-covered land, was the most sensitive to changes in SIC in the NH. The reduction in mean AMS SIC generally resulted in a greater increase in the AMS-sourced precipitation over these northern Siberia regions as compared to other areas.
Increased AMS contribution to land precipitation
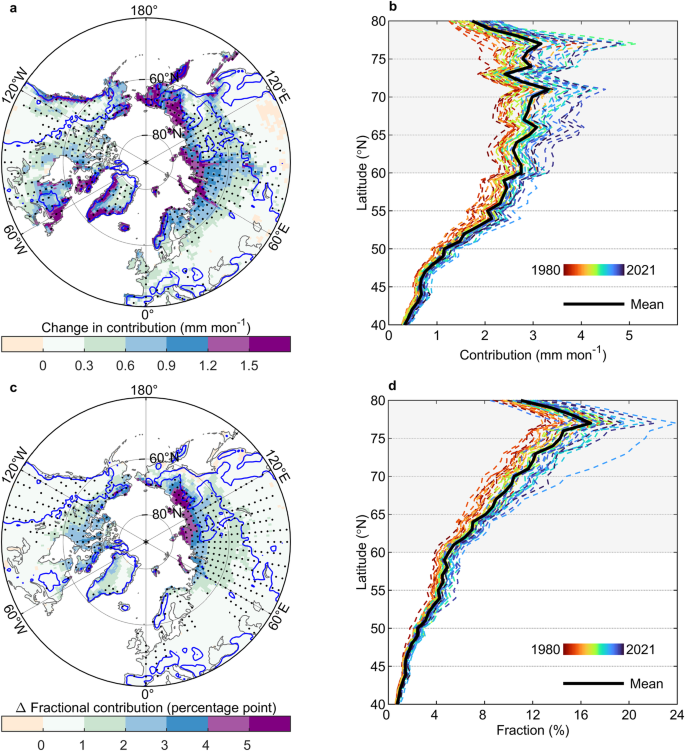
Of the total moisture evaporated from the AMS during the cold season in 1980–2021, our tracking analysis indicated an average of 24% sustained precipitation over NH land via the atmospheric moisture linkage. Because the extent of moisture supply is partially blocked by high terrain and limited by the atmospheric water vapor residence time22, the climatological mean of AMS-sourced precipitation was greater at higher latitudes than at lower latitudes (Supplementary Fig. 1a). More than 53% of the total AMS-sourced land precipitation reached its final destination on land north of 60°N (hereafter referred to as high-latitude land), resulting in a climatological contribution of 2.8 mm mon−1 high-latitude land precipitation sourced from AMS evaporation.
As sea ice has receded, the AMS-sourced precipitation increased across the majority of NH land (Fig. 2a). The total increase of AMS-sourced precipitation over the NH was 29.6 Gt mon−1 in 1980–2021, of which 28% and 72% contributed to rainfall and snowfall (Supplementary Fig. 2), respectively. Approximately 60% of the additional precipitation occurred over high-latitude land, equivalent to 1 mm mon−1 (Fig. 2b).
Areas of largest increases were concentrated in coastal areas near the AMS, such as the Scandinavian mountains in North Europe; Novaya Zemlya; the coastal areas of Greenland, Baffin Bay and the Labrador Peninsula along Baffin Bay-Davis Strait-Labrador Sea; as well as the Chukchi and Kamchatka Peninsulas in East Siberia. Storms that form and track through these regions can capture a substantially larger quantity of AMS moisture to feed their cold-season precipitation, as compared with weather systems located farther inland23,24.
Moreover, the enhanced contribution to areas of rapidly increasing precipitation adjacent to the AMS primarily occurred in the form of snowfall (Supplementary Fig. 2a), with an average of 83% of the growth in total AMS-sourced precipitation being dominated by snowfall over high-latitude lands. In glaciated areas such as Greenland, the additional advection of AMS moisture due to reduced sea ice significantly contributed to an average precipitation increase of 1.4 mm mon−1 during the cold seasons (a 31% increase relative to the climatological mean). The narrow western and southeastern coasts of Greenland, characterized by a steep rise in elevation and greater exposure to moist air masses than the interior, have experienced larger increases in AMS-sourced moisture than its inland icecap.
During the early cold season, an obvious increase in the contribution was observed in East Siberia and northern Alaska, which can be attributed to the more than doubling of evaporation from the seas north of adjacent coasts relative to the climatological mean in 1980–2021 (Supplementary Fig. 3a–c). At the end of the freezing period in March, the AMS-sourced precipitation increased substantially over Norway and broadly across Eastern Europe (Supplementary Fig. 3f).
The significant increase in evaporation observed in the Barents and Kara Seas (a relative increase of 80%), along with the favorable changes in water vapor fluxes transporting the AMS moisture inland, has led to an over 80% increase in AMS contribution to March precipitation over large areas of Eastern Europe and even a doubling in localized areas. This broad and prominent increase of AMS-sourced land precipitation in March is consistent with the spatial pattern of precipitation changes associated with Barents sea-ice decline found in Bailey et al.25, which extended across northern Europe to the Baltic states, spanning a latitude range of 20°.
The difference in the fractional AMS contribution between the last decade (2012–2021) and the first decade (1980–1989) indicates an increase in the proportion of land precipitation originating from the melting AMS (Fig. 2c). The fractional contribution of AMS moisture over the NH land increased from 1.7% to 2.2%, while high-latitude land showed a larger increase from 7.0% to 8.8% on average (Fig. 2d). The highest percentage growth was observed along the northern edge of Siberia, where, on average, more than 10% of the cold-season precipitation was contributed by AMS evaporation (Supplementary Fig. 1b).
However, along the Pacific and Atlantic coasts where AMS contribution amounts increased more than elsewhere, such as Norway, the Kamchatka Peninsula, and the east and west coasts of Greenland and Canada, increases in the fractional contribution were modest owing to the abundance of local precipitation.
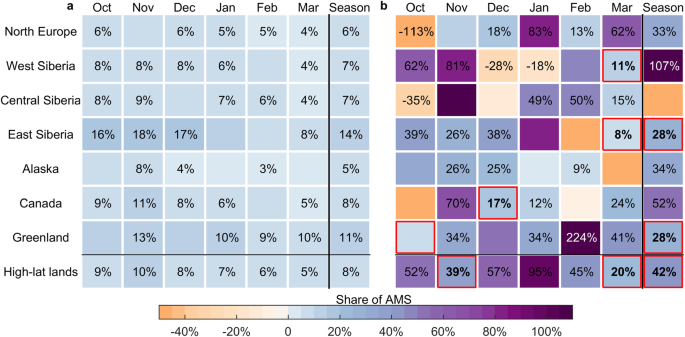
The land area of high- and mid-latitude regions was divided into 11 subregions in order to facilitate a more detailed analysis of regional variations (Supplementary Fig. 4). Given the relatively stronger influence of AMS moisture on precipitation in the AMS vicinity, the high-latitude land area was divided into seven subregions: North Europe, West Siberia, Central Siberia, East Siberia, Alaska, Canada, and Greenland. The climatological mean fractional AMS contribution to precipitation in each region is shown in Fig. 3a (for high-latitude subregions) and Supplementary Fig. 5a (for mid-latitude subregions within 60°N–40°N). Averaged across the high-latitude land, moisture from the AMS accounted for 8% of the total cold-season precipitation, while the remaining 92% originated from other sources outside the AMS (hereafter non-AMS).
Among all subregions, East Siberia and Greenland received relatively high proportions of AMS-sourced precipitation, exceeding 10% (14% and 11%, respectively). Throughout the cold season, the fractional contribution reached a maximum in November, when the AMS moisture accounted for 10% of high-latitude land precipitation. The effect of increased AMS moisture on total precipitation change is shown in Fig. 3b, expressed as the percentage of AMS-sourced precipitation trend relative to the total precipitation trend.
Positive values indicate that the increase in AMS moisture promoted the steady growth of cold-season precipitation over most subregions, with significant increases in East Siberia and Greenland (28%). The increased contribution of AMS moisture to Greenland precipitation suggests that the sea-ice decline contributed to glacier mass gain via atmospheric moisture transport, an important negative feedback in the Arctic region.
An exception is Central Siberia where the negative value implies that the increase in AMS moisture did not compensate for the decrease in total precipitation owing to water vapor deficits caused by non-AMS sources (Supplementary Fig. 6). For high-latitude land as a whole, the enhanced moisture from the AMS consistently contributed to the overall increasing trend in precipitation. The AMS-sourced precipitation increased by 0.24 mm mon−1 dec−1 (p < 0.05), bringing the overall trend in precipitation to 0.57 mm mon−1 dec−1 (p < 0.05) during the cold season.
Even though only 8% of total high-latitude precipitation originated from the AMS, 42% of the increasing trend was attributable to the significant trend in AMS-sourced precipitation. The change in moisture supplied by non-AMS sources was responsible for the remaining 58% of the precipitation trend. Over the mid-latitude land, the AMS moisture accounted for only 3% of precipitation on average, which made a slight but still positive contribution to changes in precipitation (Supplementary Fig. 5).
Increased AMS contribution to extreme snowfall
The high proportion of snowfall to total precipitation (about 85% in high-latitude lands during the 1980–2021 cold seasons) raises concerns about extreme snowfall as a potential increasing hazard. We defined extreme snowfall as the occurrence of daily snowfall exceeding 10 mm (water equivalent)26. Annually, 11% of AMS-sourced land precipitation in the NH was in the form of extreme snowfall, equivalent to 60.3 Gt yr−1 of water. With the higher frequency and enhanced intensity of extreme snowfall over land, the contribution of AMS moisture to extreme snowfall has increased by 37% relative to its climatological mean. The notable increase was concentrated along the North Atlantic and North Pacific coasts (Fig. 4a).
Compared with the changes in AMS-sourced total snowfall, which were significantly influenced by the distance from the AMS source (Supplementary Fig. 2a, b), these narrow strips of land between mountains and oceans were typically more affected during extreme events. The lifting and cooling of airflows rich in AMS moisture favored the formation of clouds and snowfall as they encountered land, leading to a preference for these specific regions, evident in both extreme snowfall events and the climatological AMS contribution to them (Supplementary Fig. 7a, c).
Furthermore, changes in atmospheric circulation, such as the increased frequency of blocking circulations associated with the rise in sea level pressure and sea ice loss20, along with the air masses containing more AMS moisture, greatly contributed to the AMS evaporation sustaining extreme snowfall near the North Pacific and North Atlantic coasts. The spatially heterogeneous changes in fractional contribution during extreme snowfall exhibited large increases in Baffin Island and northern East Siberia (Fig. 4b).
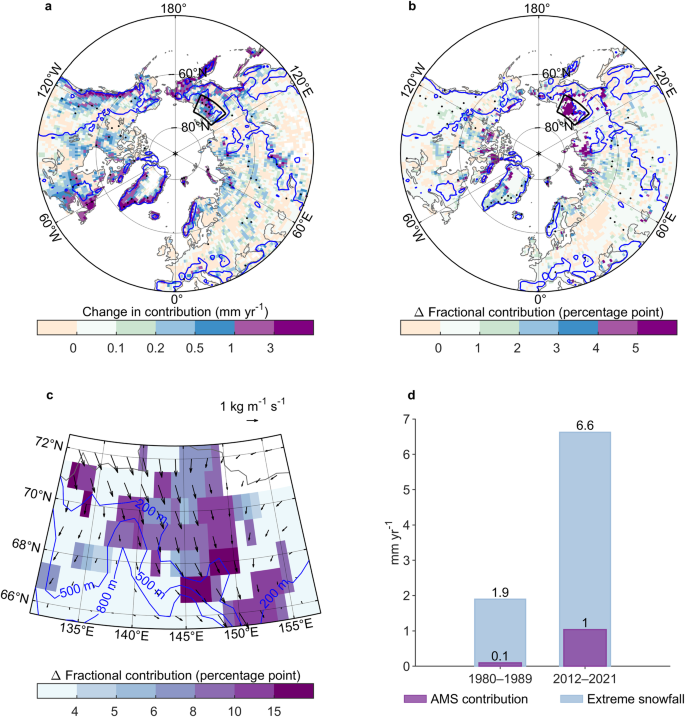
A small but distinct area within the Kolyma Lowland in northern East Siberia, historically not prone to extreme snowfall, exhibited the most significant surge in the extreme snowfall fueled by AMS moisture (Fig. 4a). The coincidence of substantial increases in both absolute and fractional amounts of AMS contribution to extreme snowfall over this region is noteworthy (outlined by the black box in Fig. 4a, b), and hence an enlarged view is presented (Fig. 4c). The additional water vapor supplied by the escalating evaporation from the sea to the north of the region was transported by the enhanced southward atmospheric moisture flux.
Blocked by mountainous terrain farther south, AMS moisture contributed substantially to the occurrence of extreme snowfall along the upslope terrain. Additionally, the frequent cold advection in this area is conducive to local frigid temperatures15, favoring precipitation in solid form. The rise in AMS contribution from 0.1 to 1.0 mm yr−1, therefore, contributed to 20% of the increase in extreme snowfall, from 1.9 to 6.6 mm yr−1 across the Kolyma Lowland (Fig. 4d). Changes in extreme snowfall over this region were an important contributor to increasing the cold-season precipitation.
Discussion
The recently ice-free areas of the Arctic Ocean represent a growing source of atmospheric moisture. This is evident in the 14% increase in AMS evaporation and a 16% increase in the AMS contribution to NH land precipitation per million square kilometers loss of sea ice area. While AMS evaporation alone is not enough to significantly alter the large-scale distribution of specific humidity and cloud water27, our findings highlight a notable 32% increase in the land precipitation originating from the AMS during 1980–2021.
This increase accounted for 42% of the overall trend in increased precipitation over high-latitude land during the study period through the atmospheric transport of water vapor. Consequently, the additional moisture from the AMS, resulting from a rapidly warming and melting Arctic, emerges as a crucial factor in the evolving precipitation patterns over land, exerting a disproportionately high influence on the overall precipitation trends.
In the northern part of Siberia, despite not being traditionally prone to extreme snowfall, both the amount and fraction of AMS moisture contribution to its extreme snowfall have significantly increased. These findings support the notion that the increased AMS moisture has played a substantial role in the observed upsurge in snowfall along coastal Siberia during the late 2010s28,29.
Beyond the larger moisture contribution, the snowy winters in this region are also influenced by several related processes. Increased fluxes of sensible and latent heat from the expanding ice-free AMS can affect the large-scale circulation through the dilation of geopotential height surfaces. This, in turn, reduces poleward temperature gradients that favor a weaker zonal jet and the formation or reinforcement of Ural blocking30,31. A pattern resembling the negative Arctic Oscillation may arise, which can shift storm tracks southward over East Asia20,32.
Hence, the increase in the moisture supply from the AMS is not solely due to changes in evaporation, but may also be influenced by circulation changes, including the potential migration of water vapor transport routes. Additionally, the changes detected in extreme snowfall warrant caution when generalizing them to future scenarios with different warming, given subtle shifts in precipitation types, such as the increased dominance of rainfall in the future warmer Arctic region33.
Additional evaporation favors the humidification of the atmospheric boundary layer and an increased moisture supply from the Arctic20,25 to deeper and earlier snow cover on high-latitude land34. However, the ongoing temperature rise will eventually lead to rain-dominated precipitation33,35,36, reducing the proportion of AMS moisture fueling snowfall.
Numerical moisture tracking involves the atmospheric water vapor budget as determined by model simulations and/or observations. High-resolution reanalysis output is commonly utilized at high latitudes where observations are scarce, which means the results may be sensitive to the accuracy and consistency of the reanalysis variables. ERA5 output was selected for this study due to its higher resolution and generally more realistic representation than other reanalysis products in the pan-Arctic region37,38,39,40, along with a superior coupling with varying sea-ice cover formulated in its Integrated Forecasting System.
However, attention must be paid to the caveats regarding discrepancies between different reanalysis datasets and tracking approaches in the quantification of moisture transport in the Arctic region, as reaffirmed in previous studies41,42. In addition, the water vapor tracking model still faces some difficulties and uncertainties.
Compared with the published dataset on global atmospheric moisture flows, referred to as UTrack43, which indicated that the monthly climatological AMS-sourced precipitation over the NH land accounted for 27.9% ± 5.7% of the global total, we calculated a statistically lower proportion of 24.8% ± 3.8% during the same period (see supplementary discussion and Supplementary Fig. 8). Although the two-layer algorithm allows the vertical transport of moisture to be parameterized by the water balance, water vapor is still released in a weighted form under the “well-mixed” model assumption, limiting the difference in the vertical distribution of precipitation efficiency44.
These challenges and uncertainties faced by this water vapor tracking model are still what we and the community are committed to tackling. Consistent with the majority of studies focusing on Arctic atmospheric water vapor25,45,46, our study did not specifically differentiate the contributions of ice or snow sublimation from the total evaporation contribution.
Sublimation, which is a principal pathway for moisture loss from the cryosphere, adds to the evaporation changes resulting from ice retreat, and is influenced by the altered atmospheric boundary layer humidity conditions and surface winds47. Although these specific differences were not the primary focus of this study, they merit further examination through mechanistic analysis with more detailed data and processes.
Our findings identify the regions where the AMS-sourced precipitation over land has experienced significant changes, and provide quantitative insights for evaluating the impacts of Arctic sea ice retreat on moisture cycling. We conclude that the ongoing expansion of the ice-free Arctic Ocean is emerging as a significant contributor to the increase in cold-season precipitation and extreme snowfall over NH land areas.
Over glaciated areas such as Greenland, sea-ice decline is contributing to glacier mass gain through atmospheric moisture transport. In the northern part of Siberia, extreme snowfall arises due to the increased AMS-sourced moisture contribution. These findings emphasize the necessity for credible projections of Arctic sea-ice loss to better understand and project future changes in the water cycle across the NH.
Methods
Data
For input to our numerical model, we used atmospheric and surface output from the ERA5 reanalysis48, produced by the European Centre for Medium-Range Weather Forecasts. The ERA5 resource offers a generally more accurate global precipitation and evaporation balance and improved performance in the Arctic relative to other reanalysis datasets12,38,39,49. We used global hourly data at a resolution of 1° × 1°from September to March during 1980–2021, provided on 23 pressure levels from 200 to 1000 hPa for zonal and meridional winds and specific humidity, and on the single level for precipitation, evaporation, sea ice coverage, snow, surface pressure, total column water, and vertical integration of atmospheric water fluxes.
We additionally used daily Arctic sea ice concentration (SIC) at 25 km resolution from the Sea Ice Index, Version 3 (G02135)50, obtained from the National Snow and Ice Data Center (NSIDC). The NSIDC data were resampled to a 1-degree resolution to match the resolution of ERA5 data for the comparison of sea ice data sources and the delineation of the AMS boundaries. Sensitivity and correlation analyses between moisture and NSIDC sea ice were included in the Supplementary information (Supplementary Fig. 9). For both ERA5 and NSIDC sea ice data, grid-scale analysis was conducted using SIC, and regional-scale analysis was performed using the sea ice coverage area of AMS calculated based on SIC.
A global dataset of evaporation to precipitation flows generated with UTrack, a Lagragian (trajectory-based) moisture tracking model43, was employed to validate the accuracy of moisture tracking in WAM-2layers. The UTrack output, driven by ERA5 reanalysis data, provided monthly climatological means for the period of 2008–2016. This dataset serves as a network for identifying and quantifying the relative distribution of downwind precipitation associated with evaporation from specific sources. We utilized UTrack data with a spatial resolution of 1° for October through March.
Atmospheric moisture tracking
The evaporated moisture from the AMS was computationally tracked in the framework of the Water Accounting Model-2layers (WAM-2layers)44,51. WAM and its derived public data52 have been widely used in the study of moisture recycling53,54, atmospheric moisture tracking55,56,57 and the influence of hydrological cycle changes58,59. The division of the bottom and the top layer depends on the surface pressure according to: [Pa]51.
In a single cycle of water vapor tracking, the AMS moisture whose final destination fell on land grids in the NH was collected to quantify their contribution to sustaining land precipitation (or snowfall), defined as AMS-sourced land precipitation (or snowfall).
The fractional contribution is defined as the percentage of AMS-sourced moisture in the precipitation or snowfall, which equals to the mixing ratio on the grid scale.
The WAM model, which is a global model based on the Eulerian framework on a Gaussian grid, cannot track water vapor across the poles due to the large distortion of the grid near the poles. Therefore, in this study, moisture tracking was performed within the near-global range of 81°N–79°S, and the input data were linearly interpolated in time61,62,63. The time step was set to a 4-minute interval to maintain the computational stability of the model within the study range of 1-degree resolution, especially in the high-latitude grids.
The evaporation for each month was tracked to the end of the next month to ensure that about 90% of the monthly evaporated moisture was precipitated out53,64, minimizing the amount of residual moisture originating from the AMS remaining in the atmosphere after tracking. Thus, precipitation from October to March is contributed by the evaporation from September to March. These months, September–March, were collectively defined as the cold season. A cold season spans two calendar years, and so we defined the year for each cold season as the year in which it began.
The change of each variable was estimated by the product of the linear fit slope and the length of time, and the relative change thereby was calculated by dividing the estimated change by the climatological mean. The sensitivity of variables to melting sea ice was defined as the ratio of variable change to sea ice index change. The significance of trend fitting and difference was evaluated using the Student’s t-test.
Data availability
All data needed to evaluate the conclusions in the paper are presented in the paper and/or the Supplementary Materials. Gridded ERA5 reanalysis data are available from https://doi.org/10.24381/cds.bd0915c6 and https://doi.org/10.24381/cds.adbb2d47. Sea-ice data from the National Snow and Ice Data Center are available from https://doi.org/10.7265/N5K072F8. UTrack data are available from https://doi.org/10.1594/PANGAEA.912710.
Code availability
The Water Accounting Model-2 layers (WAM-2layers) moisture tracking scheme in Python code are available from https://github.com/ruudvdent/WAM2layersPython.
References
- Tian, Y. et al. Atmospheric energy sources for winter sea ice variability over the north barents–kara seas. J. Clim. 35, 5379–5398 (2022).Article Google Scholar
- Deng, J. & Dai, A. Sea ice–air interactions amplify multidecadal variability in the North Atlantic and Arctic region. Nat. Commun. 13, 2100 (2022).Article CAS Google Scholar
- Holland, M. M., Finnis, J., Barrett, A. P. & Serreze, M. C. Projected changes in Arctic Ocean freshwater budgets. J. Geophys. Res.-Biogeosci. 112, G04S55 (2007).Article Google Scholar
- Kopec, B. G., Feng, X., Michel, F. A. & Posmentier, E. S. Influence of sea ice on Arctic precipitation. Proc. Natl Acad. Sci. USA. 113, 46–51 (2016).Article CAS Google Scholar
- Screen, J. A. et al. Consistency and discrepancy in the atmospheric response to Arctic sea-ice loss across climate models. Nat. Geosci. 11, 155–163 (2018).Article CAS Google Scholar
- Suo, L. et al. Atmospheric response to the autumn sea-ice free Arctic and its detectability. Clim. Dyn. 46, 2051–2066 (2016).Article Google Scholar
- Tang, Q. Global change hydrology: Terrestrial water cycle and global change. Sci. China-Earth Sci. 63, 459–462 (2020).Article Google Scholar
- Tang, Q., Zhang, X. & Francis, J. A. Extreme summer weather in northern mid-latitudes linked to a vanishing cryosphere. Nat. Clim. Chang. 4, 45–50 (2014).Article Google Scholar
- Bintanja, R. & Selten, F. M. Future increases in Arctic precipitation linked to local evaporation and sea-ice retreat. Nature 509, 479–482 (2014).Article CAS Google Scholar
- Boisvert, L. N., Wu, D. L. & Shie, C.-L. Increasing evaporation amounts seen in the Arctic between 2003 and 2013 from AIRS data. J. Geophys. Res. -Atmos. 120, 6865–6881 (2015).Article Google Scholar
- Ford, V. L. & Frauenfeld, O. W. Arctic precipitation recycling and hydrologic budget changes in response to sea ice loss. Glob. Planet. Change 209, 103752 (2022).Article Google Scholar
- Nygård, T., Naakka, T. & Vihma, T. Horizontal moisture transport dominates the regional moistening patterns in the Arctic. J. Clim. 33, 6793–6807 (2020).Article Google Scholar
- Ridley, J. K., Blockley, E. W. & Ringer, M. A. Arctic sea ice causes seasonal differences in the response of arctic water vapor to climate warming in the CMIP6 Model, HadGEM3-GC3.1. Geophys. Res. Lett. 50, e2022GL102541 (2023).Article Google Scholar
- Screen, J. A., Simmonds, I., Deser, C. & Tomas, R. The atmospheric response to three decades of observed arctic sea ice loss. J. Clim. 26, 1230–1248 (2013).Article Google Scholar
- Cohen, J. et al. Recent Arctic amplification and extreme mid-latitude weather. Nat. Geosci. 7, 627–637 (2014).Article CAS Google Scholar
- Frolov, D. Considerable Arctic Sea ice loss as a factor of cold weather and heavy snowfalls in Eurasia. IOP Conf. Ser.: Earth Environ. Sci. 1023, 012006 (2022).Article Google Scholar
- Song, M. & Liu, J. The role of diminishing Arctic sea ice in increased winter snowfall over northern high-latitude continents in a warming environment. Acta Oceanol. Sin. 36, 34–41 (2017).Article Google Scholar
- Valkonen, E., Cassano, J. & Cassano, E. Arctic cyclones and their interactions with the declining sea ice: a recent climatology. J. Geophys. Res. -Atmos. 126, e2020JD034366 (2021).Article Google Scholar
- Tang, Q., Zhang, X., Yang, X. & Francis, J. A. Cold winter extremes in northern continents linked to Arctic sea ice loss. Environ. Res. Lett. 8, 014036 (2013).Article Google Scholar
- Liu, J., Curry, J. A., Wang, H., Song, M. & Horton, R. M. Impact of declining Arctic sea ice on winter snowfall. Proc. Natl Acad. Sci. USA. 109, 4074–4079 (2012).Article CAS Google Scholar
- Ma, X. et al. ENSO and QBO modulation of the relationship between Arctic sea ice loss and Eurasian winter climate. Environ. Res. Lett. 17, 124016 (2022).Article Google Scholar
- Gimeno, L. et al. The residence time of water vapour in the atmosphere. Nat. Rev. Earth Environ. 2, 558–569 (2021).Article Google Scholar
- Koyama, T., Stroeve, J., Cassano, J. & Crawford, A. Sea ice loss and arctic cyclone activity from 1979 to 2014. J. Clim. 30, 4735–4754 (2017).Article Google Scholar
- Crawford, A. D., Lukovich, J. V., McCrystall, M. R., Stroeve, J. C. & Barber, D. G. Reduced sea ice enhances intensification of winter storms over the arctic Ocean. J. Clim. 35, 3353–3370 (2022).Article Google Scholar
- Bailey, H. et al. Arctic sea-ice loss fuels extreme European snowfall. Nat. Geosci. 14, 283–288 (2021).Article CAS Google Scholar
- Lin, W. & Chen, H. Changes in the spatial–temporal characteristics of daily snowfall events over the Eurasian continent from 1980 to 2019. Int. J. Climatol. 42, 1841–1853 (2022).Article Google Scholar
- Nygård, T., Graversen, R. G., Uotila, P., Naakka, T. & Vihma, T. Strong dependence of wintertime Arctic moisture and cloud distributions on atmospheric large-scale circulation. J. Clim. 32, 8771–8790 (2019).Article Google Scholar
- Park, H., Walsh, J. E., Kim, Y., Nakai, T. & Ohata, T. The role of declining Arctic sea ice in recent decreasing terrestrial Arctic snow depths. Polar Sci. 7, 174–187 (2013).Article Google Scholar
- Pulliainen, J. et al. Patterns and trends of Northern Hemisphere snow mass from 1980 to 2018. Nature 581, 294–298 (2020).Article CAS Google Scholar
- Mori, M., Watanabe, M., Shiogama, H., Inoue, J. & Kimoto, M. Robust Arctic sea-ice influence on the frequent Eurasian cold winters in past decades. Nat. Geosci. 7, 869–873 (2014).Article CAS Google Scholar
- Zhang, J., Tian, W., Chipperfield, M. P., Xie, F. & Huang, J. Persistent shift of the Arctic polar vortex towards the Eurasian continent in recent decades. Nat. Clim. Chang. 6, 1094–1099 (2016).Article Google Scholar
- Zhang, R., Sun, C., Zhang, R., Li, W. & Zuo, J. Role of Eurasian snow cover in linking winter-spring Eurasian coldness to the autumn Arctic sea ice retreat. J. Geophys. Res. -Atmos. 124, 9205–9221 (2019).Article Google Scholar
- Bintanja, R. & Andry, O. Towards a rain-dominated Arctic. Nat. Clim. Chang. 7, 263–267 (2017).Article Google Scholar
- Ghatak, D., Frei, A., Gong, G., Stroeve, J. & Robinson, D. On the emergence of an Arctic amplification signal in terrestrial Arctic snow extent. J. Geophys. Res. 115, D24105 (2010). Google Scholar
- McCrystall, M. R., Stroeve, J., Serreze, M., Forbes, B. C. & Screen, J. A. New climate models reveal faster and larger increases in Arctic precipitation than previously projected. Nat. Commun. 12, 6765 (2021).Article CAS Google Scholar
- Dou, T. F., Pan, S. F., Bintanja, R. & Xiao, C. D. More frequent, intense, and extensive rainfall events in a strongly warming arctic. Earth Future 10, e2021EF002378 (2022).Article Google Scholar
- Avila-Diaz, A., Bromwich, D. H., Wilson, A. B., Justino, F. & Wang, S.-H. Climate Extremes across the North American Arctic in Modern Reanalyses. J. Clim. 34, 2385–2410 (2021).Article Google Scholar
- Delhasse, A. et al. Brief communication: Evaluation of the near-surface climate in ERA5 over the Greenland Ice Sheet. Cryosphere 14, 957–965 (2020).Article Google Scholar
- Graham, R. M., Hudson, S. R. & Maturilli, M. Improved performance of ERA5 in Arctic gateway relative to four global atmospheric reanalyses. Geophys. Res. Lett. 46, 6138–6147 (2019).Article Google Scholar
- Loeb, N. A., Crawford, A., Stroeve, J. C. & Hanesiak, J. Extreme precipitation in the eastern canadian arctic and greenland: an evaluation of atmospheric reanalyses. Front. Environ. Sci. 10, 866929 (2022).Article Google Scholar
- Gimeno, L. et al. Atmospheric moisture transport and the decline in Arctic Sea ice. WIREs Clim. Change 10, e588 (2019).Article Google Scholar
- Rinke, A. et al. Trends of vertically integrated water vapor over the Arctic during 1979–2016: Consistent moistening all over? J. Clim. 32, 6097–6116 (2019).Article Google Scholar
- Tuinenburg, O. A., Theeuwen, J. J. E. & Staal, A. High-resolution global atmospheric moisture connections from evaporation to precipitation. Earth Syst. Sci. Data 12, 3177–3188 (2020).Article Google Scholar
- van der Ent, R. J., Tuinenburg, O. A., Knoche, H.-R., Kunstmann, H. & Savenije, H. H. G. Should we use a simple or complex model for moisture recycling and atmospheric moisture tracking? Hydrol. Earth Syst. Sci. 17, 4869–4884 (2013).Article Google Scholar
- Papritz, L., Hauswirth, D. & Hartmuth, K. Moisture origin, transport pathways, and driving processes of intense wintertime moisture transport into the Arctic. Weather Clim. Dynam. 3, 1–20 (2022).Article Google Scholar
- Sato, T., Nakamura, T., Iijima, Y. & Hiyama, T. Enhanced Arctic moisture transport toward Siberia in autumn revealed by tagged moisture transport model experiment. npj Clim. Atmos. Sci. 5, 1–7 (2022).Article Google Scholar
- Liston, G. E. & Sturm, M. The role of winter sublimation in the Arctic moisture budget. Hydrol. Res. 35, 325–334 (2004).Article Google Scholar
- Hersbach, H. et al. The ERA5 global reanalysis. Q. J. R. Meteorol. Soc. 146, 1999–2049 (2020).Article Google Scholar
- Wang, C., Graham, R. M., Wang, K., Gerland, S. & Granskog, M. A. Comparison of ERA5 and ERA-Interim near-surface air temperature, snowfall and precipitation over Arctic sea ice: effects on sea ice thermodynamics and evolution. Cryosphere 13, 1661–1679 (2019).Article Google Scholar
- Fetterer, F., K. Knowles, W. N. Meier, M. Savoie & A. K. Windnagel. Sea Ice Index, Version 3. National Snow and Ice Data Center https://doi.org/10.7265/N5K072F8 (2017).
- van der Ent, R. J., Wang-Erlandsson, L., Keys, P. W. & Savenije, H. H. G. Contrasting roles of interception and transpiration in the hydrological cycle – Part 2: Moisture recycling. Earth Syst. Dynam. 5, 471–489 (2014).Article Google Scholar
- Link, A., van der Ent, R., Berger, M., Eisner, S. & Finkbeiner, M. The fate of land evaporation – a global dataset. Earth Syst. Sci. Data 12, 1897–1912 (2020).Article Google Scholar
- Zhang, C., Tang, Q. & Chen, D. Recent changes in the moisture source of precipitation over the Tibetan Plateau. J. Clim. 30, 1807–1819 (2017).Article Google Scholar
- Zhang, C. et al. Moisture Source Changes Contributed to Different Precipitation Changes over the Northern and Southern Tibetan Plateau. J. Hydrometeorol. 20, 217–229 (2019).Article Google Scholar
- Guo, L. et al. Effects of horizontal resolution and air–sea coupling on simulated moisture source for East Asian precipitation in MetUM GA6/GC2. Geosci. Model Dev. 13, 6011–6028 (2020).Article Google Scholar
- Zhang, Y. et al. Atmospheric basins: identification of quasi-independent spatial patterns in the global atmospheric hydrological cycle via a complex network approach. J. Geophys. Res. Atmos. 125, e2020JD032796 (2020).Article Google Scholar
- Zhang, C., Chen, D., Tang, Q. & Huang, J. Fate and changes in moisture evaporated from the Tibetan Plateau (2000–2020). Water Resour. Res. 59, e2022WR034165 (2023).Article Google Scholar
- Cui, J. et al. Global water availability boosted by vegetation-driven changes in atmospheric moisture transport. Nat. Geosci. 15, 982–988 (2022).Article CAS Google Scholar
- Wang-Erlandsson, L. et al. Remote land use impacts on river flows through atmospheric teleconnections. Hydrol. Earth Syst. Sci. 22, 4311–4328 (2018).Article Google Scholar
- van der Ent, R. J., Savenije, H. H. G., Schaefli, B. & Steele-Dunne, S. C. Origin and fate of atmospheric moisture over continents. Water Resour. Res. 46, W09525 (2010).Article Google Scholar
- Benedict, I., van Heerwaarden, C. C., van der Linden, E. C., Weerts, A. H. & Hazeleger, W. Anomalous moisture sources of the Rhine basin during the extremely dry summers of 2003 and 2018. Weather Clim. Extremes 31, 100302 (2021).Article Google Scholar
- Li, Y., Su, F., Chen, D. & Tang, Q. Atmospheric water transport to the endorheic tibetan plateau and its effect on the hydrological status in the region. J. Geophys. Res. -Atmos. 124, 12864–12881 (2019).Article Google Scholar
- van der Ent, R. J. & Savenije, H. H. G. Length and time scales of atmospheric moisture recycling. Atmos. Chem. Phys. 11, 1853–1863 (2011).Article Google Scholar
- Liu, Y., Garcia, M., Zhang, C. & Tang, Q. Recent decrease in summer precipitation over the Iberian Peninsula closely links to reduction in local moisture recycling. Hydrol. Earth Syst. Sci. 26, 1925–1936 (2022).Article Google Scholar
Acknowledgements
This work was supported by the Third Xinjiang Scientific Expedition Program (2021xjkk0800), Chinese Academy of Sciences (XDA20060402) and NSFC-DFG mobility (M-0468). C.Z. was supported by the National Key Research and Development Program of China (2023YFC3206603) and China Scholarship Council. D.C. and H.W.C were supported by the Swedish National Strategic Research Program MERGE. J.A.F. was supported by funding from the Woodwell Climate Research Center. L.R.L. was supported by the Office of Science, U.S. Department of Energy Biological and Environmental Research as part of the Regional and Global Model Analysis program area.
Author information
Authors and Affiliations
- Key Laboratory of Water Cycle and Related Land Surface Processes, Institute of Geographic Sciences and Natural Resources Research, Chinese Academy of Sciences, Beijing, ChinaYubo Liu, Qiuhong Tang & Chi Zhang
- University of Chinese Academy of Sciences, Beijing, ChinaYubo Liu & Qiuhong Tang
- Key Laboratory of Land Surface Pattern and Simulation, Institute of Geographic Sciences and Natural Resources Research, Chinese Academy of Sciences, Beijing, ChinaChi Zhang
- Department of Earth Sciences, University of Gothenburg, Gothenburg, SwedenDeliang Chen
- Woodwell Climate Research Center, Falmouth, MA, USAJennifer A. Francis
- Atmospheric, Climate, & Earth Sciences Division, Pacific Northwest National Laboratory, Richland, WA, USAL. Ruby Leung
- Department of Space, Earth and Environment, Chalmers University of Technology, Gothenburg, 41296, SwedenHans W. Chen
