Since a certain “sceptic” has recently been comparing 2024 sea ice facts extent to “20 years ago”, here’s the current JAXA/ViSHOP extent graph of selected years, including 2004:

The CryoSat-2/SMOS merged Arctic sea ice volume graph finishes on April 15th, but older data is being reanalysed and here is the latest version:
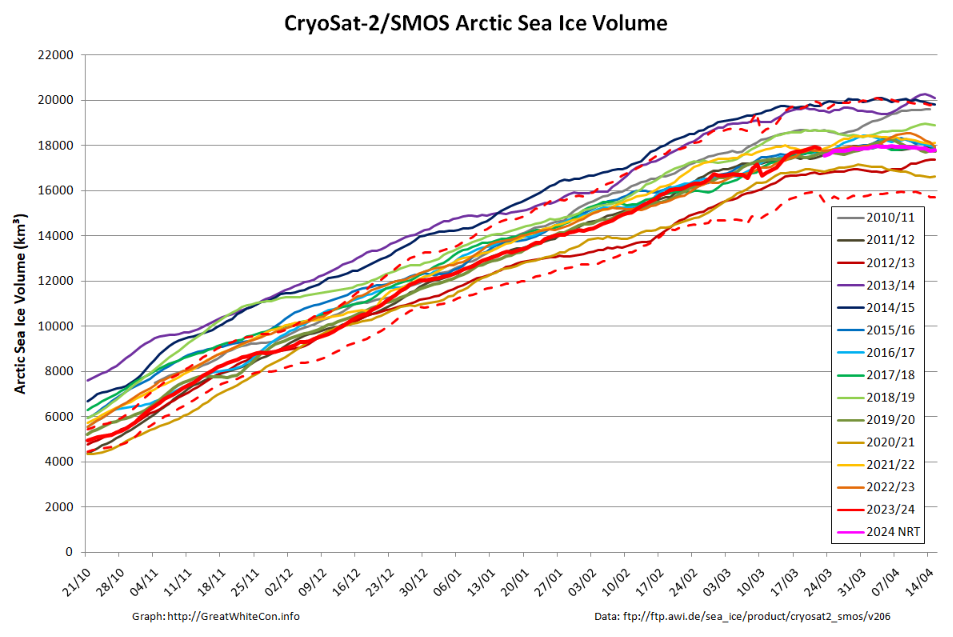
The gap in the near real time data due to the problem with the SMOS satellite during the first half of March has been filled in, but the result doesn’t look very convincing to say the least!
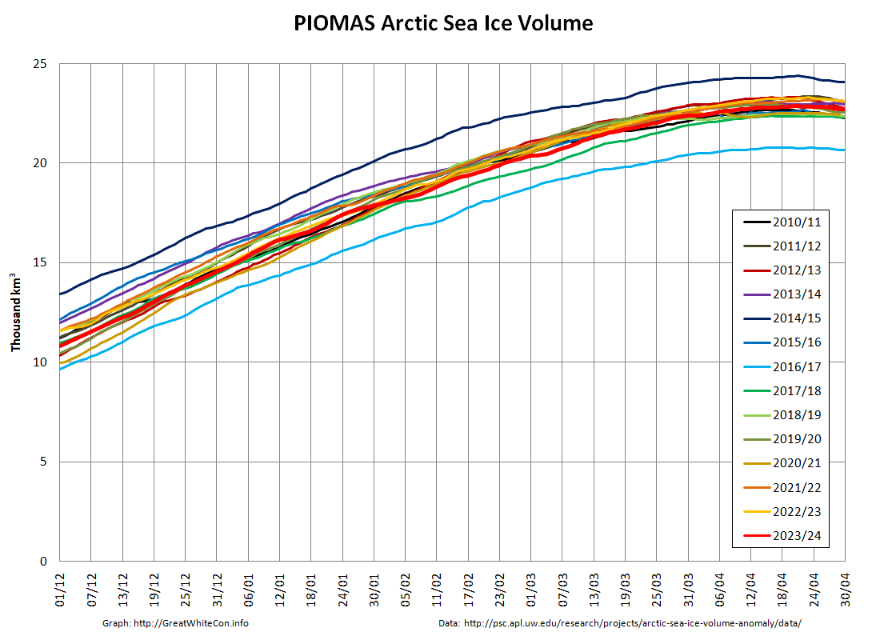
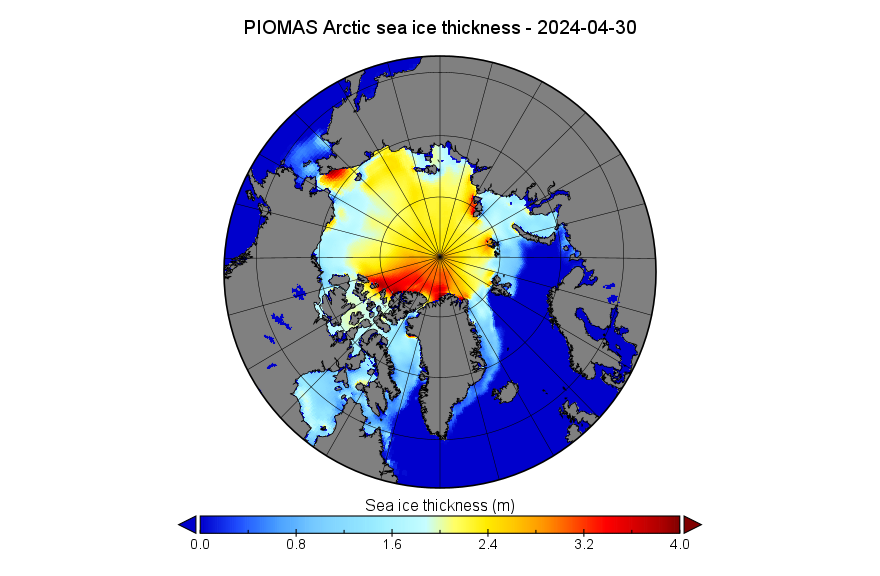
The PIOMAS gridded thickness data for April 2024 is now available. Here’s the end of month thickness map:
Maximum volume for 2024 was 22.88 thousand km³ on April 19th.
Here too is the end of month thickness map:
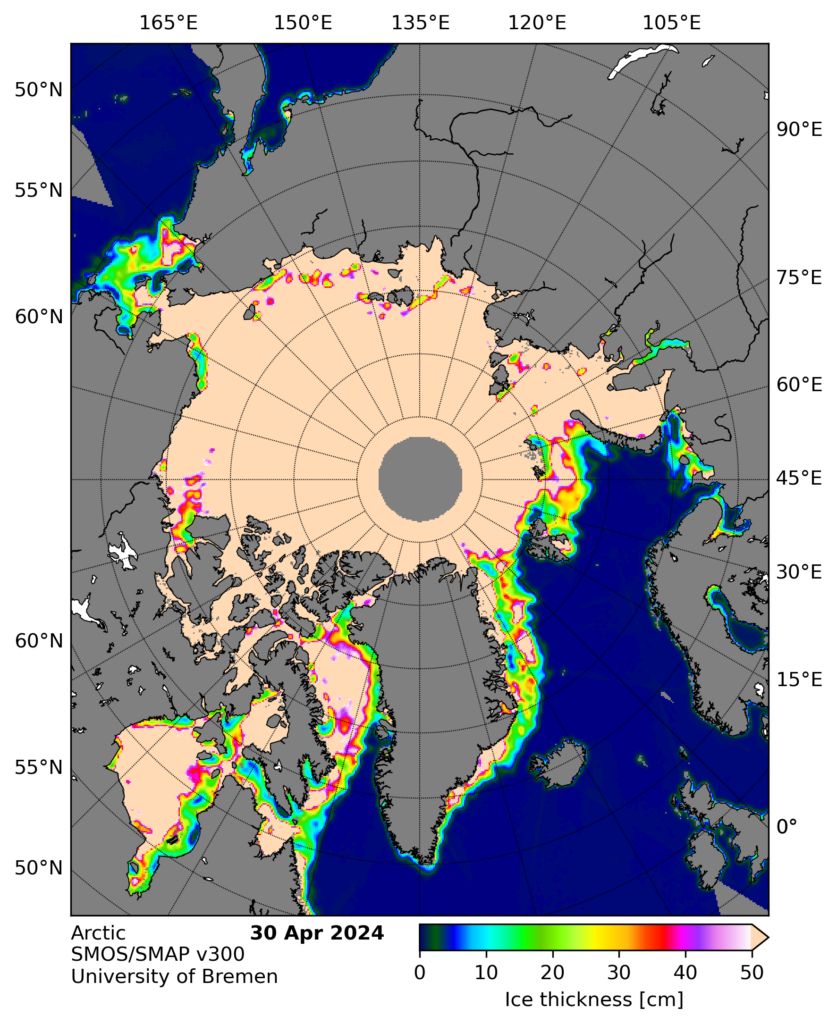
It shows the ice thickening in the Chukchi Sea, with the Beaufort Sea continuing to look vulnerable to early melt. The last SMOS/SMAP thin ice thickness map of the spring reveals thin ice in the Amundsen Gulf and eastern Beaufort Sea, as well as on the Chukchi coast of Alaska:
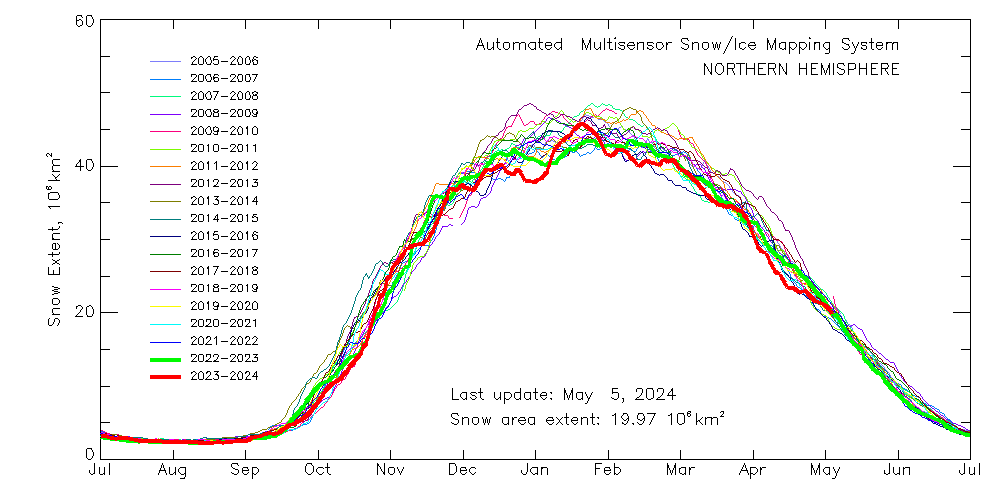
The April Rutgers Global Snow Lab northern hemisphere snow cover chart has not yet been released, so here’s the Northern Hemisphere Multisensor Snow Extent graph instead:
Watch this space!
