Starting this month with a look at assorted volume/thickness data, here is the CryoSat-2/SMOS merged Arctic sea ice thickness map for March 31st:
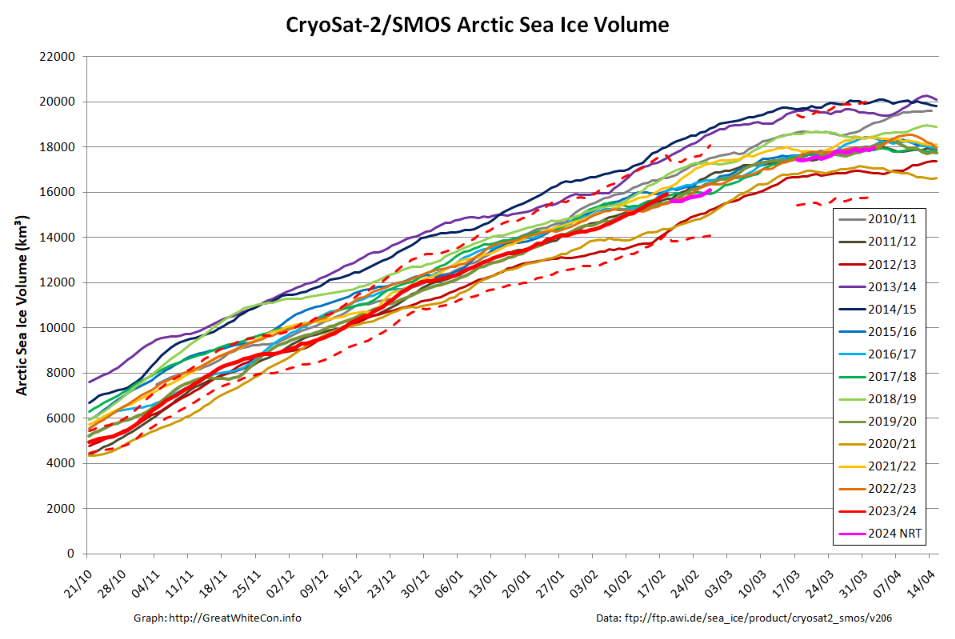
Plus the associated volume graph, which still suffers from a gap in the near real time data due to the problem with the SMOS satellite during the first half of March:
The PIOMAS gridded thickness data for March 2024 is also available. Here’s the end of month thickness map:
Plus the calculated volume graph:

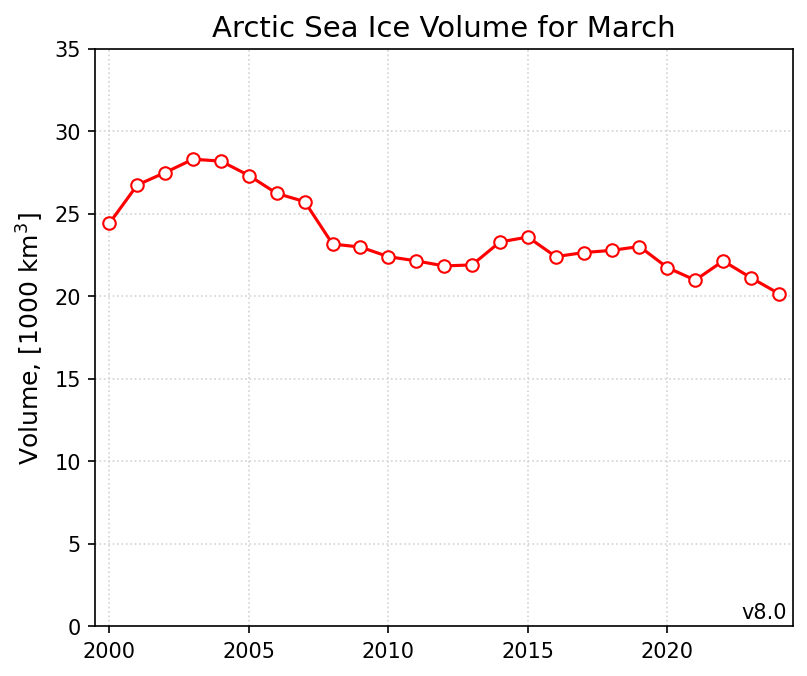
Especially for Peter, here too is the DMI’s chart of monthly Arctic sea ice volume for March:

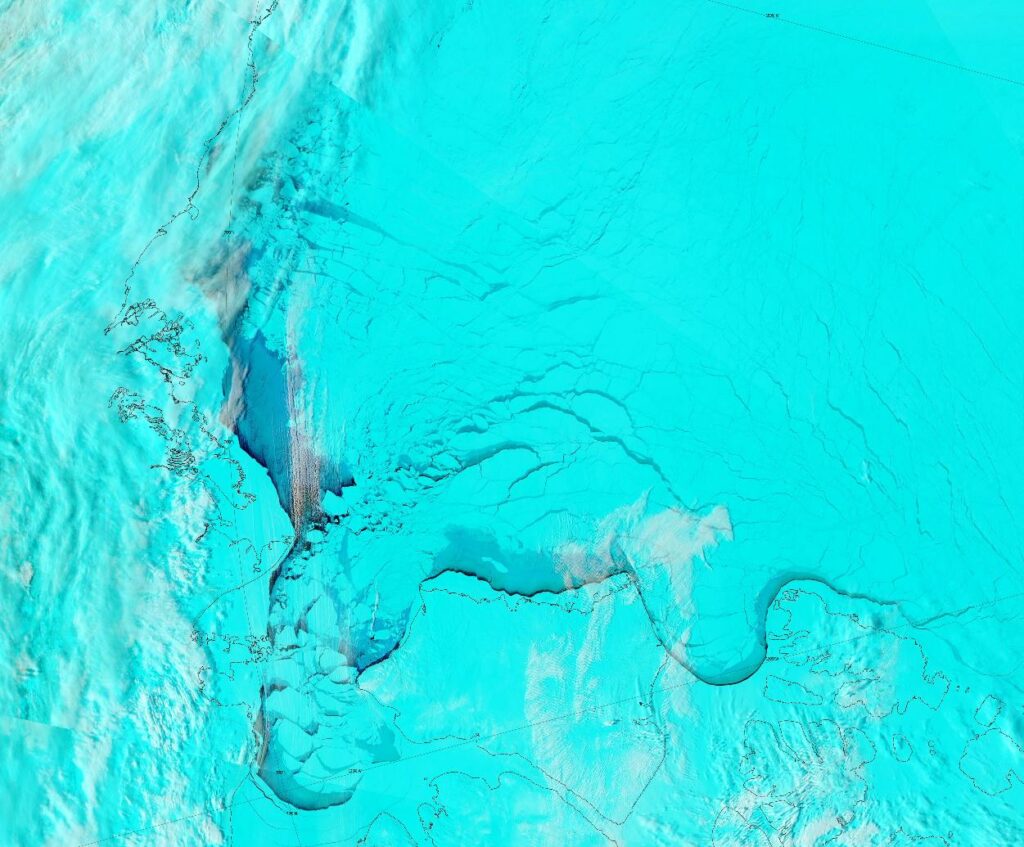
There is still no sign of the usual band of thicker ice across the Beaufort Sea, and the area of thin ice off the Mackenzie Delta in the thickness maps is also visible in MODIS imagery:

The March Rutgers Global Snow Lab northern hemisphere snow cover anomaly chart reveals a negative anomaly of almost 2 million km2, similar to last month:
Watch this space!


