
Abstract
Wetland methane (CH4) emissions over the Boreal–Arctic region are vulnerable to climate change and linked to climate feedbacks, yet understanding of their long-term dynamics remains uncertain. Here, we upscaled and analysed two decades (2002–2021) of Boreal–Arctic wetland CH4 emissions, representing an unprecedented compilation of eddy covariance and chamber observations. We found a robust increasing trend of CH4 emissions (+8.9%) with strong inter-annual variability. The majority of emission increases occurred in early summer (June and July) and were mainly driven by warming (52.3%) and ecosystem productivity (40.7%). Moreover, a 2 °C temperature anomaly in 2016 led to the highest recorded annual CH4 emissions (22.3 Tg CH4 yr−1) over this region, driven primarily by high emissions over Western Siberian lowlands. However, current-generation models from the Global Carbon Project failed to capture the emission magnitude and trend, and may bias the estimates in future wetland CH4 emission driven by amplified Boreal–Arctic warming and greening.
Main
Methane (CH4) contributes approximately 20–30% of global emission-related radiative forcing1,2, and is the second largest source of current anthropogenic warming, with a global warming potential 28–34 times larger than that of CO2 over a 100-year time horizon1,3. Wetlands are the largest and most uncertain natural source of global CH4 emissions4,5,6 and wetland CH4 emissions are closely linked to temperature7,8,9. In a substantial portion of the Boreal–Arctic (that is, including northern boreal and tundra ecoregions and also areas north of 50° characterized by rock and ice10,11), recently observed warming has been occurring three to four times faster than the global average12, and has fuelled concerns given the positive feedbacks between CH4 emissions and warming9,13,14. However, the regional response of Boreal–Arctic wetland CH4 emissions to long-term environmental change remains unknown.
Warming15 and increasing substrate availability for soil microbes due to an observed increase in vegetation productivity16 should increase CH4 production17,18, all else being equal. However, warming enhances aerobic19 and anaerobic CH4 oxidation20, and variations in inundation areas21,22 could offset increased CH4 production. In the Boreal–Arctic region, both positive and negative trends have been reported with top-down (TD; that is, atmospheric transport inversion) and bottom-up (BU; that is, using terrestrial ecosystem models) approaches17,18,23 due to several sources of uncertainty, including parameterization of biogeochemical processes17,18, representation of atmospheric transport and photochemical sinks6,24,25, wetland inundation dynamics6,21 and limited ground observations6,26,27.
The magnitude of Boreal–Arctic regional wetland CH4 emissions also remains highly uncertain6,24,28,29,30,31, with previous estimates ranging from about 9 to 53 Tg CH4 yr−1 (refs. 6,28,32,33,34,35,36,37,38,39). Although current TD models generally agreed on higher emissions relative to BU models during 2008–20176, the uncertainty ranges within both BU and TD models exceeded the magnitude of CH4 emissions they estimated. Notably, the uncertainty of the Boreal–Arctic wetland CH4 emissions is twice as large as the global atmospheric CH4 changes due to a sink–source imbalance of ~20 Tg CH4 yr−1 (ref. 25), limiting reliable conclusions on natural and anthropogenic fluxes for the global CH4 budget6,24,25.
Narrowing these substantial uncertainties in estimates of regional wetland CH4 emissions requires better understanding and model representations of the relationships between wetland CH4 emissions and environmental drivers. Previous meta-analyses have revealed a dependence of CH4 emissions on temperature from methanogen cultures to ecosystem scales9. Existing observations have also demonstrated confounding effects on CH4 emissions from other factors, including hydrologic and vegetation conditions7,8,40,41, microbial dynamics and composition42,43 and substrate availability44. Additionally, the relationships between CH4 emissions and environmental drivers show substantial hysteresis, hypothesized to result from time lags between primary productivity and its conversion to methanogenesis substrates45 and interactions between fermentation, acetate availability and acetoclastic methanogen biomass and activity46. These effects could largely modulate the timing and magnitude of CH4 emissions7,8,13,45,47 and affect model estimates7,13,28, yet they have not been explicitly considered when exploring the responses of the Boreal–Arctic wetlands to climate change.
Furthermore, Boreal–Arctic wetland CH4 emissions exhibit strong spatial heterogeneity7,41,48 and temporal variability17,27,48, highlighting the need for widespread flux observations to constrain models27. Existing eddy covariance (EC) measurements within the FLUXNET-CH4 network26,27 (Fig. 1a, red circles) over the Boreal–Arctic have been distributed over non-hotspot wetlands since 2006 (Supplementary Fig. 1a), while chamber observations (Fig. 1a, yellow circles) are available beyond EC-observed years and in wetland hotspots, that is, the Western Siberian lowlands (WSL) and Hudson Bay lowlands (HBL). Combining EC and chamber measurements thus provides expanded spatial and temporal coverage of observational constraints, albeit with challenges in reconciling the two kinds of datum with different spatial and temporal scales27.
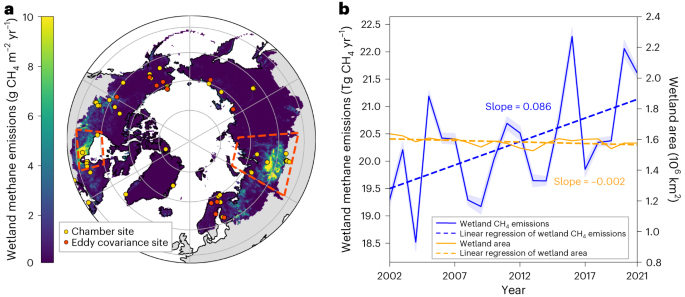
Here, we quantified the decadal responses of wetland CH4 emissions to environmental changes in the Boreal–Arctic region by considering the lagged dependence of CH4 emissions on abiotic and biotic drivers and using the largest dataset of the Boreal–Arctic CH4 compiled to date, which combines both EC tower and chamber data (Methods). The CH4 emission dataset has 139 and 168 site years of EC and chamber measurements, respectively, sampled in both hotspot and non-hotspot regions (Fig. 1a). We generated an upscaled data product of Boreal–Arctic wetland CH4 emissions during 2002–2021 using a physically interpretable and causality-guided machine learning model7. Specifically, the causal relationships between CH4 emission and its drivers inferred from observations (Methods) were used to guide model training, achieving higher accuracy than commonly used machine learning methods7. Using the upscaled dataset, we investigated the predominant drivers that regulate the long-term trend and variability of CH4 emissions. We also benchmarked the performance of BU (n = 13) and TD (n = 21) models that participated in the most recent Global Carbon Project – CH4 budget6,24.
Multidecadal temporal dynamics of wetland CH4 emissions
The upscaled Boreal–Arctic wetland CH4 emission dataset revealed that the mean annual emissions were 20.3 ± 0.9 (mean ± 1 s.d.) Tg CH4 yr−1 from 2002 to 2021, where ~53% of the total was contributed by the two hotspot areas (Fig. 1a, regions highlighted in the red boxes). Specifically, the largest hotspot was the WSL, which emitted 6.6 ± 0.5 Tg CH4 yr−1, ~57% larger than the second hotspot, the HBL (4.2 ± 0.3 Tg CH4 yr−1). The upscaled CH4 emissions were validated against randomly excluded site observations (Methods), and the Pearson correlation coefficient (R), mean absolute error and normalized mean absolute error between estimated and measured CH4 emissions were 0.89 ± 0.02, 20.81 ± 1.88 nmol CH4 m−2 s−1 and 3.65 ± 0.50% (Supplementary Fig. 2), respectively. Detailed information for the observation sites is found in Supplementary Tables 1 and 2.
Furthermore, a significant increasing trend (P < 0.05) of the Boreal–Arctic CH4 emissions was detected from 2002 to 2021 (Fig. 1b, blue line). The trend revealed an ~8.9% increase in CH4 emissions since 2002. The WSL and non-hotspot regions contributed ~56% and ~38% of the increasing trend, respectively, while no significant trend was found in the HBL (Supplementary Fig. 3). The CH4 emission enhancement during the boreal summer (June–August) contributed the most (~76%) to the annual-scale increasing trend (Supplementary Fig. 4), with ~62% of the increase occurring during early boreal summer (June and July). Previous observational work at a Siberian tundra site also documented a long-term increasing trend of CH4 emissions due to warming-induced early onset of snowmelt and vegetation growth49. We show here robust evidence of an increasing trend in the Boreal–Arctic region’s early summer CH4 emissions.
Another line of evidence for the long-term increasing trend of the Boreal–Arctic wetland CH4 emissions is the widespread increases in high-latitude atmospheric CH4 concentrations observed from the National Oceanic and Atmospheric Administration (NOAA) Global Greenhouse Gas Reference Network50. All high-latitude stations (18 in total, Supplementary Fig. 1b) exhibited positive trends in observed atmospheric CH4, and the trends of all but one station were statistically significant (P < 0.05) (Supplementary Table 3). Wetlands could be the dominant source of high-latitude CH4 emissions compared with other sources6, particularly in the boreal summer months51. The increases in atmospheric CH4 concentrations therefore probably reflect the increases in CH4 emissions from wetlands.
Drivers of wetland CH4 emission variability and trend
Since no long-term increasing changes in wetland area were found over the Boreal–Arctic region21 during the past two decades (Fig. 1b, yellow line), our results suggested that the increasing trend of regional wetland CH4 emissions was induced primarily by changes in CH4 emission intensity rather than expansion of total wetland area. After accounting for confounding effects from other abiotic and biotic factors (Methods), temperature was identified as the predominant control on wetland CH4 emission variability over the Boreal–Arctic (Fig. 2b). Specifically, temperature dominated the variability in most grid cells (42.4%), followed by gross primary productivity (GPP) (24.3%), while water-related factors (soil water content, and precipitation) dominated the other 18.3% of grid cells. Consistent patterns of the predominant drivers were also found in the two wetland hotspots, and the grid cells with wetland CH4 flux observations. About 37.7%, 59.7% and 61.3% of grid cells were dominated by temperature in the WSL, HBL and the full observation-covered area, respectively (Fig. 2a and Supplementary Fig. 5). Temperature is closely linked to wetland CH4 production and emissions, while GPP could be a proxy for substrate availability and plant-mediated CH4 transport7,8,47. The dominance of temperature and GPP effects is consistent with previous studies7,8,41,47, implying a potential sensitivity of wetland CH4 emissions to warming and vegetation activities52.
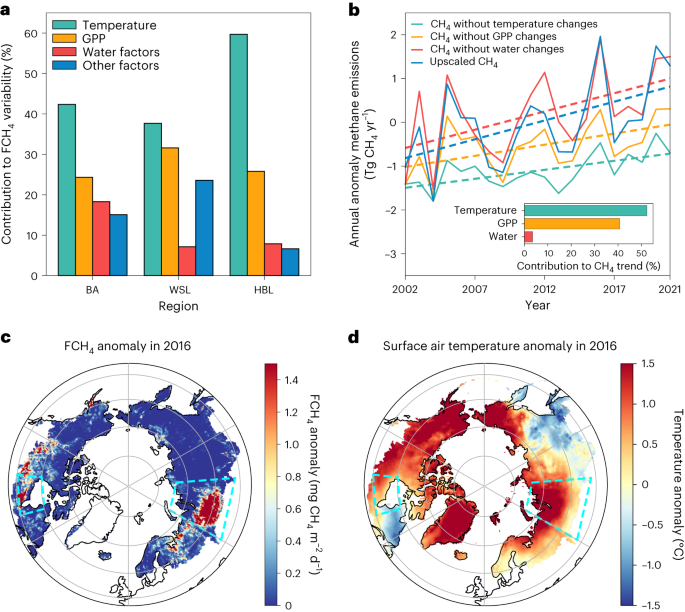
For potential drivers of the Boreal–Arctic wetland CH4 emission trend, we used a statistical model (Methods)53,54 to partition the contributions from various factors including temperature, vegetation activities and water conditions. We found that in the Boreal–Arctic (Fig. 2b) temperature explained 52.3% of the increasing CH4 emission trend, followed by GPP (40.7%). In the Boreal–Arctic, significant increases in temperature12 and GPP52,55 have been detected using satellite-based products. While warming can increase both wetland CH4 production and oxidation in observations19,20 and model simulations56, our analysis here revealed net positive effects of temperature on CH4 emissions. Meanwhile, warming has also increased vegetation productivity in the Boreal–Arctic52, which could promote plant-mediated CH4 transport via aerenchyma tissue and increase organic substrate supply for microbes. The increase of substrate availability could fuel methanogens57,58,59, leading to an increase in wetland CH4 emissions49.
Given the dominant control of temperature on wetland CH4 emissions, high CH4 emissions can be triggered by abnormally high temperatures over high-emission wetlands. Anomalously high (2005, 2016 and 2020) and low (2004, 2009 and 2014) CH4 emission years (Fig. 2b) had higher and lower annual-mean temperatures, respectively, particularly in the two CH4 hotspot regions (Supplementary Figs. 6 and 7). The highest-emission year occurred in 2016 (Fig. 2c,d), which was the warmest year in the high latitudes since 195012. The anomalously high temperature in 2016 was suggested to be caused by the major El Niño event during 2015–201660,61. This strong El Niño event changed large-scale divergence and convergence patterns and upper-level moisture transport62, leading to subsequent changes in adiabatic warming over the Arctic surface61,63. The resultant high temperature happened to overlap with wetland hotspots (Fig. 2d) and induced a sharp increase (~15.5% higher emissions relative to 2002) in wetland CH4 emissions, particularly over the WSL (Fig. 2c). All sites except one (covering 2016 and its adjacent years) agreed with anomalously high wetland CH4 emissions in 2016 when the temperature was anomalously high (Supplementary Table 4). These results highlight the role of major El Niño–Southern Oscillation events in driving wetland CH4 emission variability64,65,66, and demonstrate a critical ecological teleconnection from the sea surface temperature of the tropical Pacific to the Boreal–Arctic wetland CH4 emissions.
Implications for modelling wetland CH4 emissions
Most of the current generation of BU and TD models in the Global Carbon Project CH4 budget6 did not capture the observed magnitude and trend of wetland CH4 emissions in the Boreal–Arctic (Fig. 3a,b). For emission magnitude, 19 out of 21 TD models overestimated and 9 out of 13 BU models underestimated the Boreal–Arctic wetland CH4 emissions when compared with our upscaled dataset (Fig. 3b, Supplementary Fig. 8 and Supplementary Table 5). The rest (4 of 13) of the BU models overestimated the Boreal–Arctic wetland CH4 emissions by 18% to 139%, with the ensemble median of all BU models (16.66 Tg CH4 yr−1) lower than that of the observationally constrained upscaled dataset (Fig. 3a). For the long-term trend, the majority (10 of 13) of BU models did not show the significantly increasing trend, while the other BU models with increasing trends differed by up to sixfold in trend magnitude relative to the upscaled trend. More (12 of 21) TD models exhibited significant increasing trends, but the trend magnitude differed by a factor ranging from 2 to 16 (Supplementary Table 5).
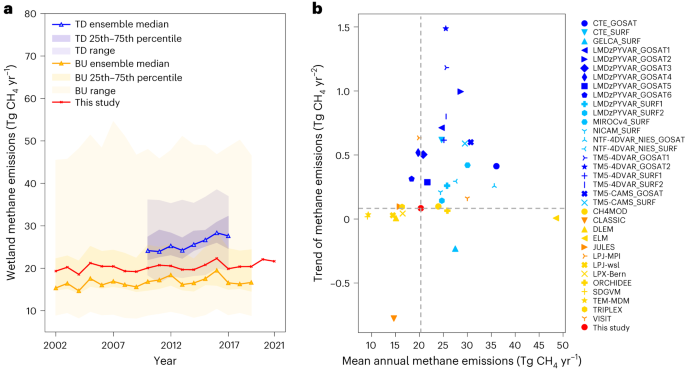
The lack of increasing trends in most of the current-generation process-based biogeochemical models suggests probable underestimation of future warming-induced increases in wetland CH4 emissions. Future Boreal–Arctic warming could further increase the intensity of wetland CH4 emissions and stimulate a large increase in wetland extent due to permafrost thaw14 and greater precipitation67. The underestimated increasing trend indicates that the BU model underestimated intensity in wetland emissions rather than wetland extent since all models prescribed the same wetland extent data21 with no significant temporal changes in wetland area (Fig. 1b). The underestimated intensity of CH4 emissions therefore could be multiplied by future expanded wetland area, leading to amplified underestimation of wetland CH4 emissions and their positive feedbacks with warming. The upscaling models showed good performance and confirmed the increasing wetland CH4 emission trend in the Boreal–Arctic during 2002–2021, even considering the uncertainties from which site observations were used and validation schemes (Supplementary Fig. 9), wetland extent (Supplementary Fig. 10a) and input variables (Supplementary Fig. 10b). The increasing wetland CH4 emissions in the high latitudes indicate the growingly important role of biogenic CH4 emissions in rising atmospheric CH468,69,70. Underrating the upward trend of wetland CH4 emissions, therefore, suggests underestimated biogenic contributions to observed increases in atmospheric CH4 and radiative forcing25.
Our data-driven, long-term and spatially explicit wetland CH4 emission dataset opens up new opportunities to better understand the dynamics of the Boreal–Arctic wetland CH4 emissions and could facilitate the improvement of BU and TD models. The upscaled dataset is well constrained by widespread observations, particularly during the summer season (Supplementary Tables 1 and 2) when the major increasing trend of wetland CH4 emissions was reported. The dataset also explicitly considers the frequently acknowledged but underrepresented hysteresis characteristics in wetland CH4 emissions7,8,13. We demonstrated the dominant controls of temperature and GPP on the CH4 emission trend and variability, suggesting the priority of refining CH4 emission temperature sensitivity and plant-modulated CH4 emission processes in BU models. For example, the temperature dependence of CH4 emissions has been empirically represented and poorly parameterized in biogeochemical models13. Plant-mediated microbial substrate availability is strongly linked to CH4 emissions57, yet has rarely been mechanistically represented in models13. Current biogeochemical models have little consensus on model structure or complexity in representing wetland CH4 emissions71. Confidence in model predictions is limited by knowledge gaps and ability to validate models across time and space. This new benchmark dataset could aid validation and parameterizations of the highly uncertain biogeochemical processes related to CH4 emissions. Additionally, the upscaled dataset provides better prior information for TD transport inversion models, thereby allowing for more reliable separation of natural and anthropogenic CH4 emission effects on atmospheric CH4 concentrations.
Methods
Wetland datasets
We used the WAD2M dataset21 derived from active and passive microwave remote sensing as the prescribed wetland extent. When compared with the optical-sensor-based products, the microwave-sensor-based WAD2M product can identify water conditions below vegetation canopies; the product also mitigated the risks of double counting wetland and water bodies in the Boreal–Arctic region by fusing multisource wetland extent datasets21. A promising capability of the WAD2M dataset is its ability to capture the inter-annual variations of wetland extent21. In addition to inundation dynamics, clear differences in the magnitude and processes of wetland CH4 emissions have been reported across different wetland types7,8,41,47. Therefore, wetland types extracted from the Boreal–Arctic Wetland and Lake Dataset (BAWLD)11 were used to separately model wetland CH4 emissions across bogs, fens, marshes and tundra. The BAWLD dataset also avoided the double-counting problem11. All wetland grid cells in the BAWLD dataset that provided the wetland type information were considered for upscaling, and the wetland type percentage provided by the BAWLD dataset was used for partitioning the wetland extent of the corresponding grid cells in the WAD2M dataset for each wetland type (Supplementary Section 1).
In addition, we also used other wetland datasets, including static wetlands from the Global Lakes and Wetlands Database74, and temporally dynamic model-derived wetlands75 calibrated by observations from Global Inundation Extent from Multi-Satellites76 and Regularly Flooded Wetland77. We discussed the temporal changes of wetland CH4 emissions in the Boreal–Arctic during 2002–2021 related to the uncertain wetland extent. More details of the three wetland datasets used and the sensitivity experiments are given in Supplementary Section 3.
Input datasets
Temperature-, plant- and water-related variables that have been shown to be important for explaining wetland CH4 dynamics were used as input drivers for upscaling7,8,41,47. Specifically, the input variables include soil temperature (TS), air temperature (TA), GPP, air pressure (PA), precipitation (P), wind speed (WS), snow cover (SC) and soil water content (SWC). GPP was obtained from the GOSIF dataset78, which was derived on the basis of solar-induced chlorophyll fluorescence (SIF) observed with the Orbiting Carbon Observatory-2 and its linear relationship with GPP79,80. Other variables were obtained from the land component of the fifth generation of European Reanalysis (ERA5-Land) datasets73 because of the high accuracy and physical consistency among different variables73,81,82. All variables were unified to the same temporal (7 d) and spatial (0.5°) resolution, and the final upscaled dataset had the same spatiotemporal resolution as the inputting variables.
Additionally, we also used other sources of input datasets to assess the sensitivity of the temporal changes of wetland CH4 emissions in the Boreal–Arctic during 2002–2021 to uncertainties in the input datasets. These additional datasets included University of East Anglia Climatic Research Unit Japanese Reanalysis83, Global Land Data Assimilation System84, Modern-Era Retrospective Analysis for Research and Applications v.2 85 and Penman–Monteith–Leuning GPP86 datasets. More details of the datasets used and the sensitivity experiments are given in Supplementary Section 4.
Wetland CH4 emission observations
Substantial spatial heterogeneity of wetland CH4 emissions has been highlighted in the literature7,41,48, and therefore sparse observations may impede reliable upscaling. To overcome this issue of spatial heterogeneity, we first compiled a comprehensive CH4 dataset that broadly covered the Boreal–Arctic region, by combining the FLUXNET-CH4 dataset27, the BAWLD-CH4 dataset28 and the chamber dataset in ref. 48. We selected all chamber sites that explicitly included the wetland types considered here and start and end months of the observations28,48. We used quality-assured observed wetland CH4 emissions at EC sites instead of gap-filled data. In total, this study included 139 and 168 site years of EC and chamber measurements, respectively. Detailed information (including site identifier, wetland type, location, temporal coverage, digital object identifier and references) on the sites is listed in Supplementary Tables 1 and 2. The compiled and upscaled dataset will be made available upon reasonable request.
Causality-guided machine learning (Causal-ML) upscaling
A Causal-ML model7 with good physical interpretability and accuracy was used for upscaling the wetland CH4 emissions. The model first identified the causal relationships between each driver and CH4 emission by excluding the confounding effects from other drivers through a PCMCI method7,87,88,89,90 (PC refers to the model inventors, P. Spirtes and C. Glymour91, and MCI is the acronym for momentary conditional independence90). The PCMCI method has been frequently used in Earth science88,90,92,93,94,95, and is particularly suitable for inferring multivariate controlled and time-lagged causal relationships90,93,94,95, such as those between wetland CH4 emission and its drivers7,8,47 (see Supplementary Section 2 for more details of the causality inference). Then, the identified causal structures along with the model biases between observations and model simulations were used to guide model training. This modelling strategy helps reduce model biases and improve model physics7. Another benefit of this Causal-ML model is the representation of time-lagged controls, which has been shown to be important for understating and modelling wetland CH4 dynamics7,13. Here, we considered the substantial intra-seasonal hysteresis found within wetland CH4 emissions13, and differentiated the wetland-type-dependent CH4 emission processes by building Causal-ML models for each wetland type. We randomly sampled 10% of site observations that the Causal-ML model had never seen as the testing dataset, and used the remaining 80% and 10% of the dataset to train and validate the model7, respectively. Through each experiment including data sampling and model training, we derived a Causal-ML model, and we repeated the experiments and upscaled the wetland CH4 emission dataset 20 times. The ensemble mean of the 20 upscaled datasets was used to analyse the wetland CH4 dynamics, and the s.d. was considered as the upscaling uncertainty related to trained model parameters caused by random data sampling. In addition, we also used the leave-one-out and temporal-cross-validation schemes for model evaluation and upscaling. For the leave-one-out scheme, we iteratively removed data from each site, retrained the model and then evaluated model performance7. For the temporal-cross-validation scheme, we used 20% and 80% of temporally continuous data for each site as the testing and training datasets, respectively. With the well trained models from the two additional validation schemes, we upscaled the wetland CH4 emissions during 2002–2021. For high-frequency (that is, weekly, daily and hourly) measurements, the errors between modelled and observed wetland CH4 emissions at the weekly scale were used in the objective function to direct the model training; for low-frequency (for example, some chamber observations only provided seasonal or annual-mean) measurements, the mean values of modelled and measured wetland CH4 emissions during the observation period were compared and used in the objective function. Details of the model parameter settings, model training and validation are given in our previous work7.
Identifying dominant controls on wetland CH4 variability
To separate dominant controls on the inter-annual variations of wetland CH4 emissions, we used a simple method of partial correlation92. We conducted analyses between CH4 emission intensity and all input variables at the annual scale for each grid cell. Before the partial correlation analysis, the annual anomaly of each variable was derived by subtracting the long-term (2002–2021) annual mean and removing the inter-annual trend92. For each grid cell, the driver with the highest magnitude (absolute value) of partial correlation coefficient was determined as the dominant driver. Finally, we classified all the drivers into four groups, including temperature (TS and TA), GPP, water-related factors (P and SWC) and others (WS, PA and SC). We acknowledge that the dependence of wetland CH4 emissions on environmental predictors could vary across spatiotemporal scales8,49,96. Here we mainly focused on the dynamics of wetland CH4 emissions at the inter-annual scale. At this scale, we found strong relationships between CH4 emissions and environmental variables related to temperature, water and vegetation, consistent with previous studies27,49. We also acknowledge that these environmental variable dependences could vary over space, and become weaker when the dominant factors are beyond those considered in this study96. Due to spatial heterogeneity, we reported the dominant controls on the basis of the summary statistics of all wetland grid cells in the studied region with the CH4 dynamics significantly explained by the considered environmental factors.
Quantifying dominant controls on wetland CH4 emission trend
Following previous studies97,98, a statistical linear regression model was used to quantify the controls from different drivers on the trend of wetland CH4 emissions. In particular, we first built a linear model driven by all temporally changing input factors denoted Modelall, to quantify the responses of wetland CH4 emissions to environmental changes for each wetland grid cell. Then we iteratively held one group of factors, including temperature, GPP and water-related factors, constant at the corresponding initial level while allowing the other factors to change over time. For example, we used ModelT to represent the model results that held temperature constant at 2002 values and allowed all the other factors to change over time. Similarly, we used ModelGPP and Modelwater to represent the model results that kept GPP and water-related variables constant, respectively, while other factors varied over time. The differences ∆CH4(T), ∆CH4(GPP) and ∆CH4(Water) (equations (1)–(3)) were regarded as the impacts of changes in temperature, GPP and water-related variables on wetland CH4 emission changes, respectively. The trend differences were regarded as the contributions from each group of factors to the increasing trend in wetland CH4 emissions97,98. The model parameters (that is, the slope and intercept) for each grid cell were obtained by minimizing the sum of ordinary least squares of the errors53,54,99.
Data availability
Data are available from the following sites: WAD2M, https://zenodo.org/records/3998454; BAWLD, https://doi.org/10.18739/A2C824F9X (ref. 72); GOSIF, https://globalecology.unh.edu/data/GOSIF-GPP.html; ERA5-Land, https://www.ecmwf.int/en/forecasts/datasets/reanalysis-datasets/era5.
Code availability
The code used in this study is available at ref. 100.
References
- Bergamaschi, P. et al. Atmospheric CH4 in the first decade of the 21st century: inverse modeling analysis using SCIAMACHY satellite retrievals and NOAA surface measurements. J. Geophys. Res. Atmos. 118, 7350–7369 (2013).ADS CAS Google Scholar
- Ciais, P. et al. Carbon and other biogeochemical cycles. in Climate Change 2013: The Physical Science Basis. Contribution of Working Group I to the Fifth Assessment Report of the Intergovernmental Panel on Climate Change (eds Stocker, T. F. et al.) Ch. 6 (Cambridge Univ. Press, 2013).
- Neubauer, S. C. & Megonigal, J. P. Moving beyond global warming potentials to quantify the climatic role of ecosystems. Ecosystems 18, 1000–1013 (2015).Google Scholar
- Bousquet, P. et al. Contribution of anthropogenic and natural sources to atmospheric methane variability. Nature 443, 439–443 (2006).ADS CAS PubMed Google Scholar
- Chen, Y. H. & Prinn, R. G. Estimation of atmospheric methane emissions between 1996 and 2001 using a three-dimensional global chemical transport model. J. Geophys. Res. Atmos. 111, D10 (2006).Google Scholar
- Saunois, M. et al. The global methane budget 2000–2017. Earth Syst. Sci. Data 12, 1561–1623 (2020).ADS Google Scholar
- Yuan, K. et al. Causality guided machine learning model on wetland CH4 emissions across global wetlands. Agric. Meteorol. 324, 109115 (2022).Google Scholar
- Knox, S. H. et al. Identifying dominant environmental predictors of freshwater wetland methane fluxes across diurnal to seasonal time scales. Glob. Change Biol. 27, 3582–3604 (2021).CAS Google Scholar
- Yvon-Durocher, G. et al. Methane fluxes show consistent temperature dependence across microbial to ecosystem scales. Nature 507, 488–491 (2014).ADS CAS PubMed Google Scholar
- Olson, D. M. et al. Terrestrial ecoregions of the world: a new map of life on Earth: a new global map of terrestrial ecoregions provides an innovative tool for conserving biodiversity. BioScience 51, 933–938 (2001).Google Scholar
- Olefeldt, D. et al. The Boreal–Arctic Wetland and Lake Dataset (BAWLD). Earth Syst. Sci. Data 13, 5127–5149 (2021).ADS Google Scholar
- Rantanen, M. et al. The Arctic has warmed nearly four times faster than the globe since 1979. Commun. Earth Environ. 3, 168 (2022).ADS Google Scholar
- Chang, K.-Y. et al. Substantial hysteresis in emergent temperature sensitivity of global wetland CH4 emissions. Nat. Commun. 12, 2266 (2021).ADS CAS PubMed PubMed Central Google Scholar
- Zhang, Z. et al. Emerging role of wetland methane emissions in driving 21st century climate change. Proc. Natl Acad. Sci. USA 114, 9647–9652 (2017).ADS CAS PubMed PubMed Central Google Scholar
- Jerman, V., Metje, M., Mandić-Mulec, I. & Frenzel, P. Wetland restoration and methanogenesis: the activity of microbial populations and competition for substrates at different temperatures. Biogeosciences 6, 1127–1138 (2009).ADS CAS Google Scholar
- Chen, M. et al. Regional contribution to variability and trends of global gross primary productivity. Environ. Res. Lett. 12, 105005 (2017).ADS Google Scholar
- Poulter, B. et al. Global wetland contribution to 2000–2012 atmospheric methane growth rate dynamics. Environ. Res. Lett. 12, 094013 (2017).ADS Google Scholar
- Ito, A. Methane emission from pan-Arctic natural wetlands estimated using a process-based model, 1901–2016. Polar Sci. 21, 26–36 (2019).ADS Google Scholar
- Dean, J. F. et al. Methane feedbacks to the global climate system in a warmer world. Rev. Geophys. 56, 207–250 (2018).ADS Google Scholar
- Segarra, K. et al. High rates of anaerobic methane oxidation in freshwater wetlands reduce potential atmospheric methane emissions. Nat. Commun. 6, 7477 (2015).ADS CAS PubMed Google Scholar
- Zhang, Z. et al. Development of the global dataset of Wetland Area and Dynamics for Methane Modeling (WAD2M). Earth Syst. Sci. Data 13, 2001–2023 (2021).ADS Google Scholar
- Zhuang, Q. et al. Influence of changes in wetland inundation extent on net fluxes of carbon dioxide and methane in northern high latitudes from 1993 to 2004. Environ. Res. Lett. 10, 095009 (2015).ADS Google Scholar
- Stavert, A. R. et al. Regional trends and drivers of the global methane budget. Glob. Change Biol. 28, 182–200 (2022).Google Scholar
- Saunois, M. et al. The global methane budget 2000–2012. Earth Syst. Sci. Data 8, 697–751 (2016).ADS Google Scholar
- Turner, A. J., Frankenberg, C. & Kort, E. A. Interpreting contemporary trends in atmospheric methane. Proc. Natl Acad. Sci. USA 116, 2805–2813 (2019).ADS CAS PubMed PubMed Central Google Scholar
- Delwiche, K. B. et al. FLUXNET-CH4: a global, multi-ecosystem dataset and analysis of methane seasonality from freshwater wetlands. Earth Syst. Sci. Data 13, 3607–3689 (2021).ADS Google Scholar
- Knox, S. H. et al. FLUXNET-CH4 synthesis activity: objectives, observations, and future directions. Bull. Am. Meteorol. Soc. 100, 2607–2632 (2019).ADS Google Scholar
- Kuhn, M. A. et al. BAWLD-CH4: a comprehensive dataset of methane fluxes from boreal and arctic ecosystems. Earth Syst. Sci. Data 13, 5151–5189 (2021).ADS Google Scholar
- Arctic Monitoring and Assessment Programme (AMAP) Impacts of Short-Lived Climate Forcers on Arctic Climate, Air Quality, and Human Health. Summary for Policy-Makers (AMAP, 2021).
- Arctic Monitoring and Assessment Programme (AMAP) Arctic Climate Change Update 2021: Key Trends and Impacts. Summary for Policy-Makers (AMAP, 2021).
- Arctic Monitoring and Assessment Programme (AMAP) AMAP Assessment 2015: Methane as an Arctic Climate Forcer (AMAP, 2015).
- Spahni, R. et al. Constraining global methane emissions and uptake by ecosystems. Biogeosciences 8, 1643–1665 (2011).ADS CAS Google Scholar
- McGuire, A. et al. An assessment of the carbon balance of Arctic tundra: comparisons among observations, process models, and atmospheric inversions. Biogeosciences 9, 3185–3204 (2012).ADS CAS Google Scholar
- Zhu, X., Zhuang, Q., Qin, Z., Glagolev, M. & Song, L. Estimating wetland methane emissions from the northern high latitudes from 1990 to 2009 using artificial neural networks. Glob. Biogeochem. Cycles 27, 592–604 (2013).ADS CAS Google Scholar
- Bruhwiler, L. et al. CarbonTracker-CH4: an assimilation system for estimating emissions of atmospheric methane. Atmos. Chem. Phys. 14, 8269–8293 (2014).ADS Google Scholar
- Treat, C. C., Bloom, A. A. & Marushchak, M. E. Nongrowing season methane emissions—a significant component of annual emissions across northern ecosystems. Glob. Change Biol. 24, 3331–3343 (2018).ADS Google Scholar
- Watts, J. D., Kimball, J. S., Bartsch, A. & McDonald, K. C. Surface water inundation in the boreal–Arctic: potential impacts on regional methane emissions. Environ. Res. Lett. 9, 075001 (2014).ADS Google Scholar
- Thompson, R. L. et al. Variability in atmospheric methane from fossil fuel and microbial sources over the last three decades. Geophys. Res. Lett. 45, 11499–11508 (2018).ADS CAS Google Scholar
- Peltola, O. et al. Monthly gridded data product of northern wetland methane emissions based on upscaling eddy covariance observations. Earth Syst. Sci. Data 11, 1263–1289 (2019).ADS Google Scholar
- Olefeldt, D., Turetsky, M. R., Crill, P. M. & McGuire, A. D. Environmental and physical controls on northern terrestrial methane emissions across permafrost zones. Glob. Change Biol. 19, 589–603 (2013).ADS Google Scholar
- Turetsky, M. R. et al. A synthesis of methane emissions from 71 northern, temperate, and subtropical wetlands. Glob. Change Biol. 20, 2183–2197 (2014).ADS Google Scholar
- McCalley, C. K. et al. Methane dynamics regulated by microbial community response to permafrost thaw. Nature 514, 478–481 (2014).ADS CAS PubMed Google Scholar
- Oh, Y. et al. Reduced net methane emissions due to microbial methane oxidation in a warmer Arctic. Nat. Clim. Change 10, 317–321 (2020).ADS CAS Google Scholar
- Bergman, I., Klarqvist, M. & Nilsson, M. Seasonal variation in rates of methane production from peat of various botanical origins: effects of temperature and substrate quality. FEMS Microbiol. Ecol. 33, 181–189 (2000).CAS PubMed Google Scholar
- Rinne, J. et al. Temporal variation of ecosystem scale methane emission from a boreal fen in relation to temperature, water table position, and carbon dioxide fluxes. Glob. Biogeochem. Cycles 32, 1087–1106 (2018).ADS CAS Google Scholar
- Chang, K.-Y., Riley, W. J., Crill, P. M., Grant, R. F. & Saleska, S. R. Hysteretic temperature sensitivity of wetland CH4 fluxes explained by substrate availability and microbial activity. Biogeosciences 17, 5849–5860 (2020).ADS CAS Google Scholar
- Sturtevant, C. et al. Identifying scale-emergent, nonlinear, asynchronous processes of wetland methane exchange. J. Geophys. Res. Biogeosci. 121, 188–204 (2016).CAS Google Scholar
- Bao, T., Jia, G. & Xu, X. Wetland heterogeneity determines methane emissions: a pan-Arctic synthesis. Environ. Sci. Technol. 55, 10152–10163 (2021).ADS CAS PubMed Google Scholar
- Rößger, N., Sachs, T., Wille, C., Boike, J. & Kutzbach, L. Seasonal increase of methane emissions linked to warming in Siberian tundra. Nat. Clim. Change 12, 1031–1036 (2022).ADS Google Scholar
- Sweeney, C. et al. Seasonal climatology of CO2 across North America from aircraft measurements in the NOAA/ESRL Global Greenhouse Gas Reference Network. J. Geophys. Res. Atmos. 120, 5155–5190 (2015).ADS CAS Google Scholar
- Nisbet, E. G., Dlugokencky, E. J. & Bousquet, P. Methane on the rise—again. Science 343, 493–495 (2014).ADS CAS PubMed Google Scholar
- Piao, S. et al. Characteristics, drivers and feedbacks of global greening. Nat. Rev. Earth Environ. 1, 14–27 (2020).ADS Google Scholar
- Andela, N. & Van Der Werf, G. R. Recent trends in African fires driven by cropland expansion and El Niño to La Niña transition. Nat. Clim. Change 4, 791–795 (2014).ADS Google Scholar
- Archibald, S., Nickless, A., Govender, N., Scholes, R. J. & Lehsten, V. Climate and the inter-annual variability of fire in southern Africa: a meta-analysis using long-term field data and satellite-derived burnt area data. Glob. Ecol. Biogeogr. 19, 794–809 (2010).Google Scholar
- Yang, R. et al. Divergent historical GPP trends among state-of-the-art multi-model simulations and satellite-based products. Earth Syst. Dyn. 13, 833–849 (2022).ADS Google Scholar
- Melton, J. et al. Present state of global wetland extent and wetland methane modelling: conclusions from a model inter-comparison project (WETCHIMP). Biogeosciences 10, 753–788 (2013).ADS Google Scholar
- Mitra, B. et al. Spectral evidence for substrate availability rather than environmental control of methane emissions from a coastal forested wetland. Agric. For. Meteorol. 291, 108062 (2020).Google Scholar
- Ström, L., Tagesson, T., Mastepanov, M. & Christensen, T. R. Presence of Eriophorum scheuchzeri enhances substrate availability and methane emission in an Arctic wetland. Soil Biol. Biochem. 45, 61–70 (2012).Google Scholar
- Whiting, G. J. & Chanton, J. Primary production control of methane emission from wetlands. Nature 364, 794–795 (1993).ADS CAS Google Scholar
- Hu, S. & Fedorov, A. V. The extreme El Niño of 2015–2016 and the end of global warming hiatus. Geophys. Res. Lett. 44, 3816–3824 (2017).ADS Google Scholar
- Jeong, H., Park, H.-S., Stuecker, M. F. & Yeh, S.-W. Distinct impacts of major El Niño events on Arctic temperatures due to differences in eastern tropical Pacific sea surface temperatures. Sci. Adv. 8, eabl8278 (2022).ADS PubMed PubMed Central Google Scholar
- Park, K., Kang, S. M., Kim, D., Stuecker, M. F. & Jin, F.-F. Contrasting local and remote impacts of surface heating on polar warming and amplification. J. Clim. 31, 3155–3166 (2018).ADS Google Scholar
- Ding, Q. et al. Tropical forcing of the recent rapid Arctic warming in northeastern Canada and Greenland. Nature 509, 209–212 (2014).ADS CAS PubMed Google Scholar
- Zhang, Z. et al. Enhanced response of global wetland methane emissions to the 2015–2016 El Niño–Southern Oscillation event. Environ. Res. Lett. 13, 074009 (2018).ADS PubMed PubMed Central Google Scholar
- Zhu, Q. et al. Interannual variation in methane emissions from tropical wetlands triggered by repeated El Niño Southern Oscillation. Glob. Change Biol. 23, 4706–4716 (2017).ADS Google Scholar
- Hodson, E., Poulter, B., Zimmermann, N. E., Prigent, C. & Kaplan, J. O. The El Niño–Southern Oscillation and wetland methane interannual variability. Geophys. Res. Lett. 38, L08810 (2011).ADS Google Scholar
- Cook, B. I. et al. Twenty‐first century drought projections in the CMIP6 forcing scenarios. Earth’s Future 8, e2019EF001461 (2020).ADS Google Scholar
- Nisbet, E. et al. Rising atmospheric methane: 2007–2014 growth and isotopic shift. Glob. Biogeochem. Cycles 30, 1356–1370 (2016).ADS CAS Google Scholar
- Bloom, A. A., Palmer, P. I., Fraser, A., Reay, D. S. & Frankenberg, C. Large-scale controls of methanogenesis inferred from methane and gravity spaceborne data. Science 327, 322–325 (2010).ADS CAS PubMed Google Scholar
- Peng, S. et al. Wetland emission and atmospheric sink changes explain methane growth in 2020. Nature 612, 477–482 (2022).ADS CAS PubMed Google Scholar
- Wania, R. et al. Present state of global wetland extent and wetland methane modelling: methodology of a model intercomparison project (WETCHIMP). Geosci. Model Dev. Discuss. 5, 4071–4136 (2012).ADS Google Scholar
- Olefeldt, D. et al. The Fractional Land Cover Estimates from the Boreal-Arctic Wetland and Lake Dataset (BAWLD), 2021 (Arctic Data Center, accessed 1 June 2022); https://arcticdata.io/catalog/view/doi:10.18739/A2C824F9X
- Muñoz-Sabater, J. et al. ERA5-Land: a state-of-the-art global reanalysis dataset for land applications. Earth Syst. Sci. Data 13, 4349–4383 (2021).ADS Google Scholar
- Lehner, B. & Döll, P. Development and validation of a global database of lakes, reservoirs and wetlands. J. Hydrol. 296, 1–22 (2004).ADS Google Scholar
- Xi, Y. et al. Gridded maps of wetlands dynamics over mid–low latitudes for 1980–2020 based on TOPMODEL. Sci. Data 9, 347 (2022).PubMed Central Google Scholar
- Prigent, C., Jimenez, C. & Bousquet, P. Satellite‐derived global surface water extent and dynamics over the last 25 years (GIEMS‐2). J. Geophys. Res. Atmos. 125, e2019JD030711 (2020).ADS Google Scholar
- Tootchi, A., Jost, A. & Ducharne, A. Multi-source global wetland maps combining surface water imagery and groundwater constraints. Earth Syst. Sci. Data 11, 189–220 (2019).ADS Google Scholar
- Li, X. & Xiao, J. A global, 0.05-degree product of solar-induced chlorophyll fluorescence derived from OCO-2, MODIS, and reanalysis data. Remote Sens. 11, 517 (2019).ADS Google Scholar
- Li, X. & Xiao, J. Mapping photosynthesis solely from solar-induced chlorophyll fluorescence: a global, fine-resolution dataset of gross primary production derived from OCO-2. Remote Sens. 11, 2563 (2019).ADS Google Scholar
- Li, X. et al. Solar‐induced chlorophyll fluorescence is strongly correlated with terrestrial photosynthesis for a wide variety of biomes: first global analysis based on OCO‐2 and flux tower observations. Glob. Change Biol. 24, 3990–4008 (2018).ADS Google Scholar
- Herrington, T. C., Fletcher, C. G. & Kropp, H. Validation of pan-Arctic soil temperatures in modern reanalysis and data assimilation systems. Preprint at The Cryosphere Discuss. https://doi.org/10.5194/tc-2022-5 (2022).
- Li, M., Wu, P. & Ma, Z. A comprehensive evaluation of soil moisture and soil temperature from third‐generation atmospheric and land reanalysis data sets. Int. J. Climatol. 40, 5744–5766 (2020).Google Scholar
- Harris, I. CRU JRA: Collection of CRU JRA Forcing Datasets of Gridded Land Surface Blend of Climatic Research Unit (CRU) and Japanese Reanalysis (JRA) Data (Centre for Environmental Data Analysis (CEDA), 2019).
- Rodell, M. et al. The global land data assimilation system. Bull. Am. Meteorol. Soc. 85, 381–394 (2004).ADS Google Scholar
- Gelaro, R. et al. The Modern-Era Retrospective Analysis for Research and Applications, version 2 (MERRA-2). J. Clim. 30, 5419–5454 (2017).ADS Google Scholar
- Zhang, Y. et al. Coupled estimation of 500 m and 8-day resolution global evapotranspiration and gross primary production in 2002–2017. Remote Sens. Environ. 222, 165–182 (2019).ADS Google Scholar
- Yuan, K. et al. Deforestation reshapes land-surface energy-flux partitioning. Environ. Res. Lett. 16, 024014 (2021).ADS Google Scholar
- Yuan, K., Zhu, Q., Riley, W. J., Li, F. & Wu, H. Understanding and reducing the uncertainties of land surface energy flux partitioning within CMIP6 land models. Agric. For. Meteorol. 319, 108920 (2022).Google Scholar
- Ruddell, B. L. & Kumar, P. Ecohydrologic process networks: 1. Identification. Water Resour. Res. 45, W03419 (2009).ADS Google Scholar
- Runge, J. et al. Inferring causation from time series in Earth system sciences. Nat. Commun. 10, 2553 (2019).ADS PubMed PubMed Central Google Scholar
- Spirtes, P., Glymour, C. N., Scheines, R. & Heckerman, D. Causation, Prediction, and Search (MIT Press, 2000).
- Li, F. et al. Wetter California projected by CMIP6 models with observational constraints under a high GHG emission scenario. Earth’s Future 10, e2022EF002694 (2022).ADS Google Scholar
- Runge, J., Nowack, P., Kretschmer, M., Flaxman, S. & Sejdinovic, D. Detecting and quantifying causal associations in large nonlinear time series datasets. Sci. Adv. 5, eaau4996 (2019).ADS PubMed PubMed Central Google Scholar
- Runge, J. et al. Identifying causal gateways and mediators in complex spatio-temporal systems. Nat. Commun. 6, 8502 (2015).ADS CAS PubMed Google Scholar
- Runge, J., Gerhardus, A., Varando, G., Eyring, V. & Camps-Valls, G. Causal inference for time series. Nat. Rev. Earth Environ. 4, 487–505 (2023).ADS Google Scholar
- Mastepanov, M. et al. Revisiting factors controlling methane emissions from high-Arctic tundra. Biogeosciences 10, 5139–5158 (2013).ADS Google Scholar
- Yuan, W. et al. Increased atmospheric vapor pressure deficit reduces global vegetation growth. Sci. Adv. 5, eaax1396 (2019).ADS CAS PubMed PubMed Central Google Scholar
- Li, F. et al. AttentionFire_v1. 0: interpretable machine learning fire model for burned-area predictions over tropics. Geosci. Model Dev. 16, 869–884 (2023).ADS Google Scholar
- Andela, N. et al. A human-driven decline in global burned area. Science 356, 1356–1362 (2017).ADS CAS PubMed PubMed Central Google Scholar
- Yuan, K., et al. Boreal–Arctic wetland methane emissions modulated by warming and vegetation activity. Zenodo https://zenodo.org/records/10525206 (2024).
Acknowledgements
This research was supported by a NASA Carbon Monitoring System grant (NNH20ZDA001N) and the Reducing Uncertainties in Biogeochemical Interactions through Synthesis and Computation (RUBISCO) Scientific Focus Area Project; the latter is sponsored by the Earth and Environmental Systems Modeling (EESM) Program under the Office of Biological and Environmental Research of the US Department of Energy Office of Science. K.Y. is also supported by an Early Career Development Grant (ECDG), which was sponsored by the Earth and Environmental Sciences Area of Lawrence Berkeley National Laboratory.
Author information
Author notes
- These authors contributed equally: Kunxiaojia Yuan, Fa Li.
Authors and Affiliations
- Climate and Ecosystem Sciences Division, Climate Sciences Department, Lawrence Berkeley National Laboratory, Berkeley, CA, USAKunxiaojia Yuan, William J. Riley & Qing Zhu
- Department of Forest and Wildlife Ecology, University of Wisconsin Madison, Madison, WI, USAFa Li & Min Chen
- Department of Earth and Environmental Sciences, University of Illinois Chicago, Chicago, IL, USAGavin McNicol
- Department of Earth System Science, Stanford University, Stanford, CA, USAAlison Hoyt & Robert Jackson
- Department of Geography, The University of British Columbia, Vancouver, British Columbia, CanadaSara Knox
- Department of Geography, McGill University, Montreal, Quebec, CanadaSara Knox
Contributions
Q.Z conceived of the work and experiments; K.Y. and F.L. developed the model and conducted the analysis; K.Y., G.M., M.C., S.K., W.J.R. and R.J. prepared the data. All authors contributed to the writing.
Corresponding author
Ethics declarations
Competing interests
The authors declare no competing interests.
Peer review
Peer review information
Nature Climate Change thanks Torben Christensen, Lars Kutzbach and Jean-Daniel Paris for their contribution to the peer review of this work.
Additional information
Publisher’s note Springer Nature remains neutral with regard to jurisdictional claims in published maps and institutional affiliations.
Supplementary information
Supplementary Information
Supplementary Figs. 1–10, Tables 1–5 and Sections 1–4.
Rights and permissions
Open Access This article is licensed under a Creative Commons Attribution 4.0 International License, which permits use, sharing, adaptation, distribution and reproduction in any medium or format, as long as you give appropriate credit to the original author(s) and the source, provide a link to the Creative Commons license, and indicate if changes were made. The images or other third party material in this article are included in the article’s Creative Commons license, unless indicated otherwise in a credit line to the material. If material is not included in the article’s Creative Commons license and your intended use is not permitted by statutory regulation or exceeds the permitted use, you will need to obtain permission directly from the copyright holder. To view a copy of this license, visit http://creativecommons.org/licenses/by/4.0/.


I do agree with all the ideas you have introduced on your post They are very convincing and will definitely work Still the posts are very short for newbies May just you please prolong them a little from subsequent time Thank you for the post
Good article, thanks for sharing!
I like your concept, friend.