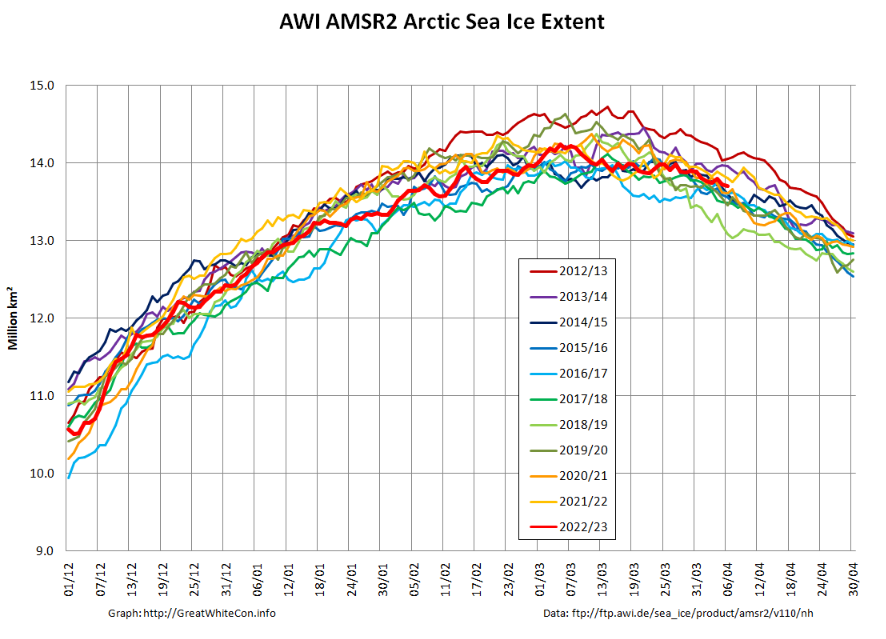
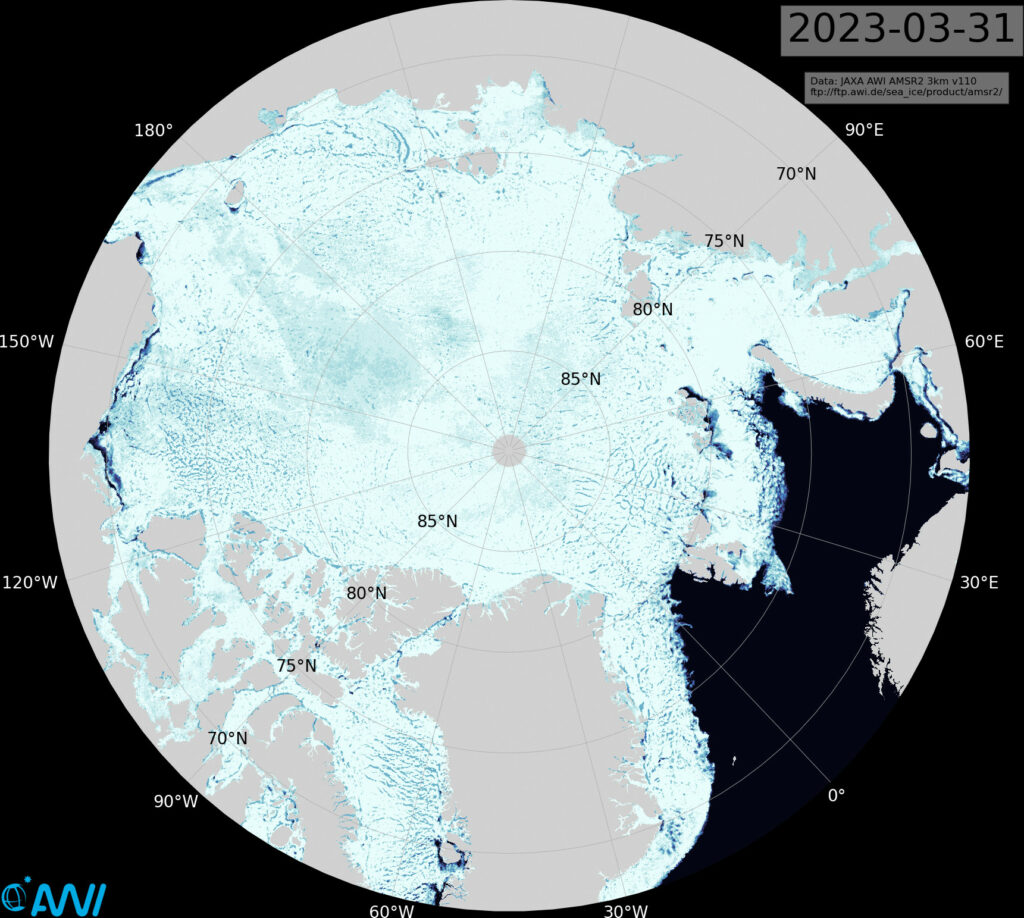
Arctic sea ice extent in early April is singularly unexceptional. Here’s the AWI AMSR2 version:
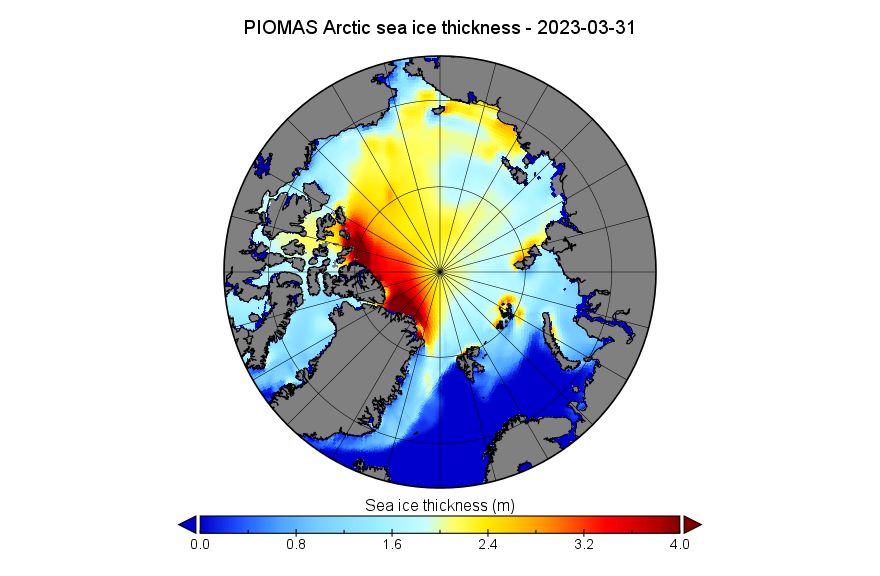
Things start to become more interesting when looking at the third dimension. Here’s the PIOMAS gridded thickness map for March 31st:
and the CryoSat-2/SMOS map for the same date:
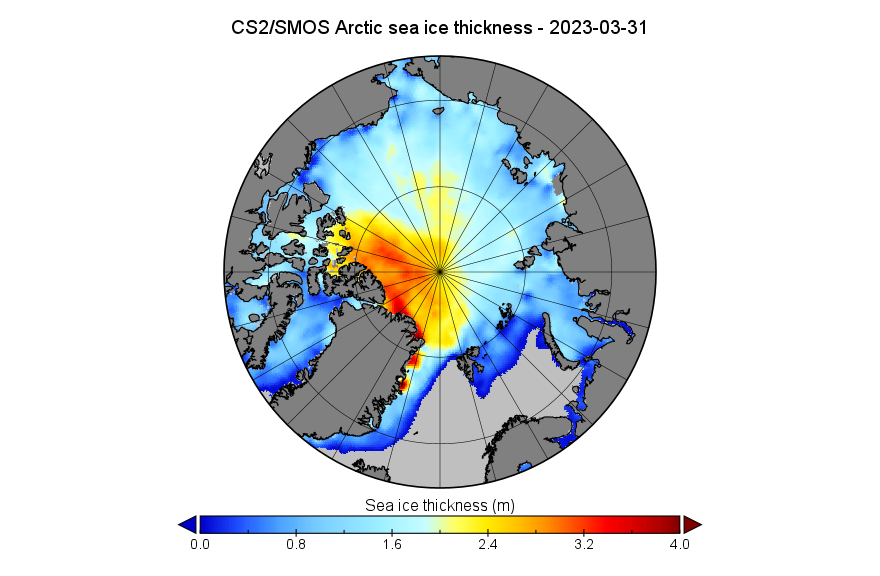
Note the differing distribution of thick ice north of Greenland and the Canadian Arctic Archipelago between the two maps. Note also the area of thinner ice along the coast of the Beaufort Sea visible on the CS2/SMOS map.
By way of explanation for that phenomenon see the March sea level pressure map from the latest edition of the NSIDC’s Arctic Sea Ice News:
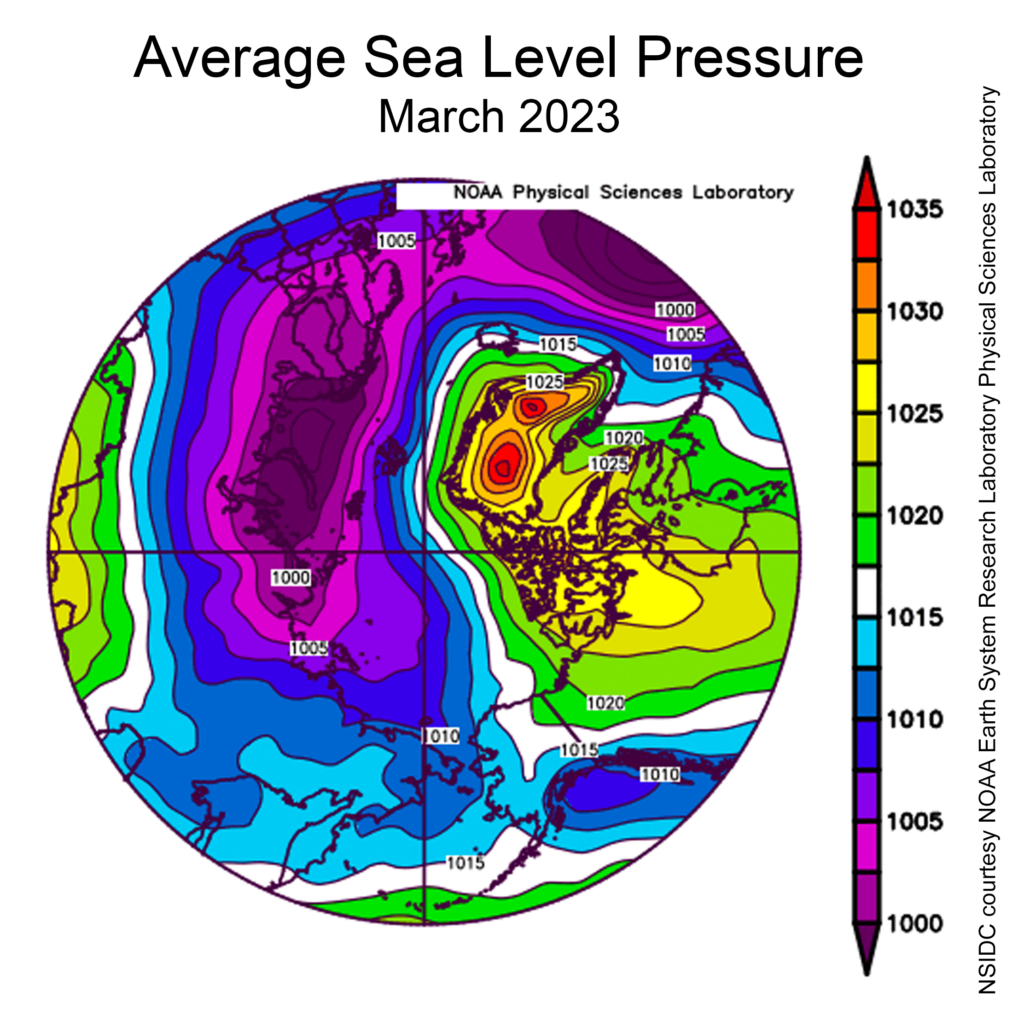
The persistent low pressure on the Siberian side of the Arctic together with high pressure over Greenland has led to significant ice drift from Alaska towards Svalbard. If you have the bandwidth for a multi megabyte download click the following image of AWI AMSR2 sea ice concentration to see an animation revealing the resulting disappearance of the area of open water north of Svalbard, and also periods of open water along the Beaufort Sea coast:
At this time of year that open water has refrozen, but another effect of the persistent ice drift is that the familiar arm of old ice in the Beaufort Sea has moved well to the north:
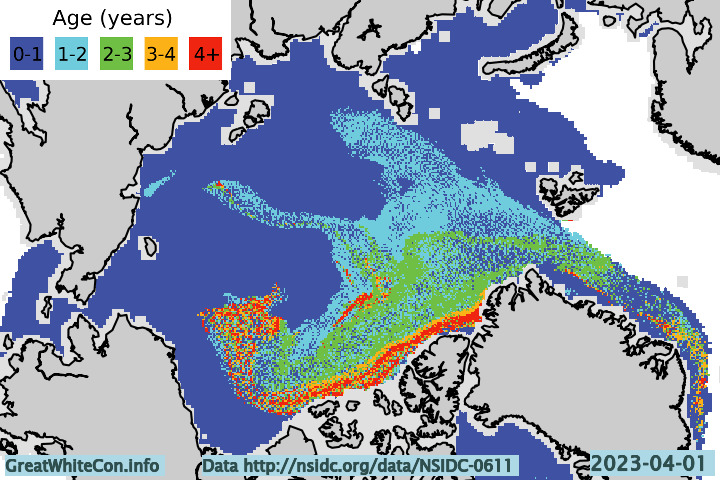
All of which suggests that this year a relatively early melt in the Beaufort Sea is likely.
The other side of the ice drift coin is that there is now plenty of old ice in the East Greenland Sea, and that regional ice extent on the Atlantic side of the Arctic is anomalously high this year:
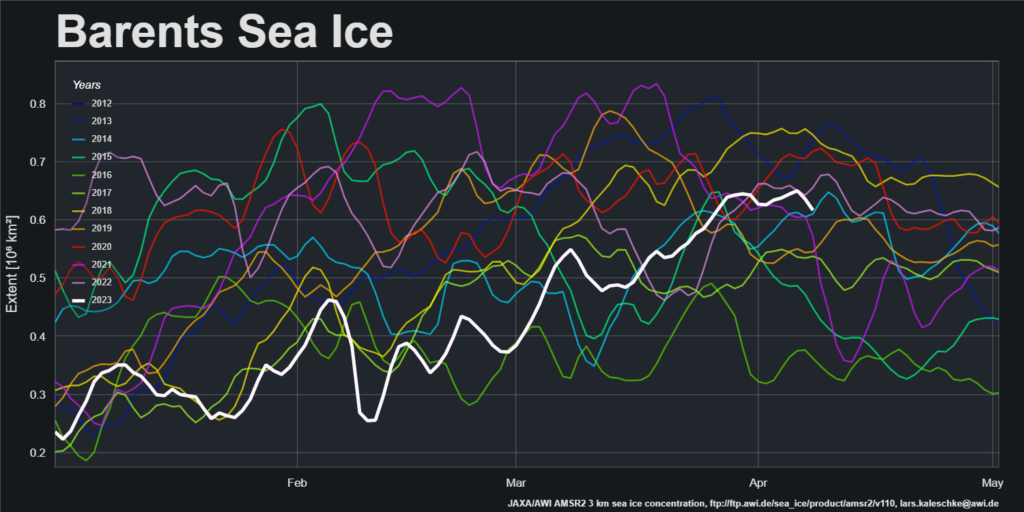
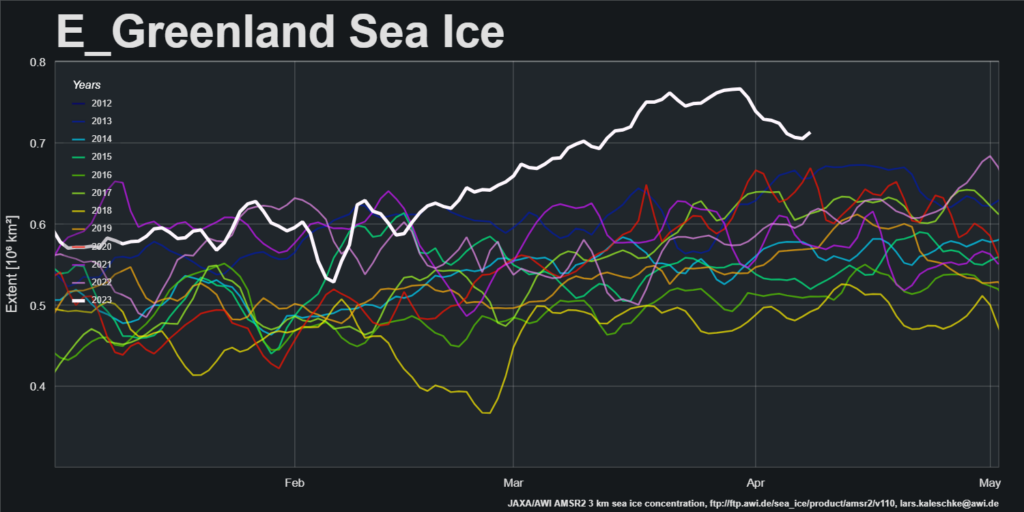
How long do you suppose it will take for all the extra ice currently heading south past the east coast of Greenland to melt?
Watch this space!

