We’ll come on to the Arctic in a moment, but at more temperate latitudes I am proud to announce that my Cornish alter ego has been officially outed as an “environmental campaigner” by the BBC. Moving pictures of yours truly, discussing drought rather than sea ice, are available via BBC iPlayer until around 18:30 this evening, possibly to UK residents only.
[Stop Press! A shorter version of Kirk England’s report on two potential desalination plants in Cornwall (also including my 15 seconds of fame!) is available here until around 22:30 this evening ]
Alternatively we have recorded our own moving pictures of this momentous event:
And an added still image as well:

Heading back to the far north, it is entirely feasible that the maximum Arctic sea ice extent of the 2023 freezing season has been reached, according to JAXA/ViSHOP at least:
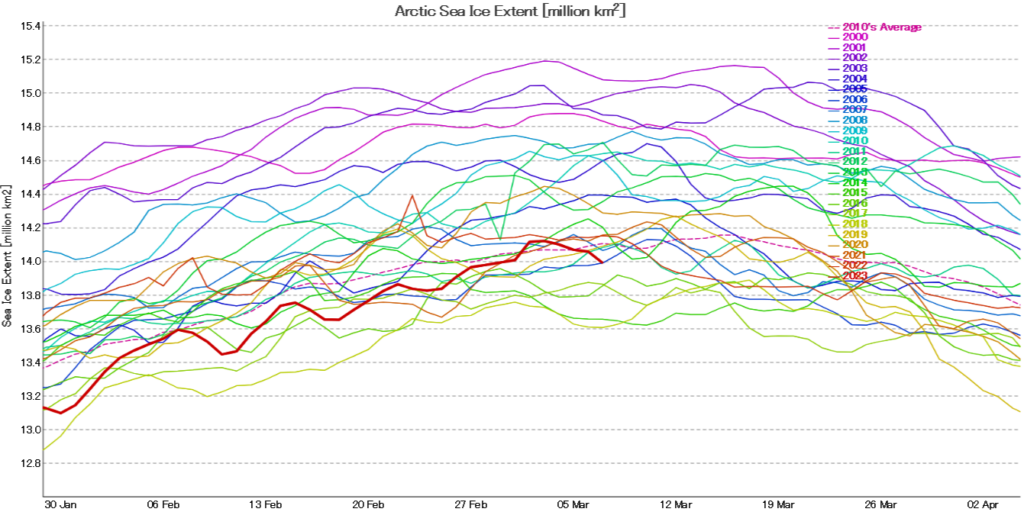
14.12 million km² on both the 2nd and 3rd of March.
In other news from within the Arctic Circle, the PIOMAS gridded thickness data for February has now been released. Here’s the modelled thickness map for February 28th:
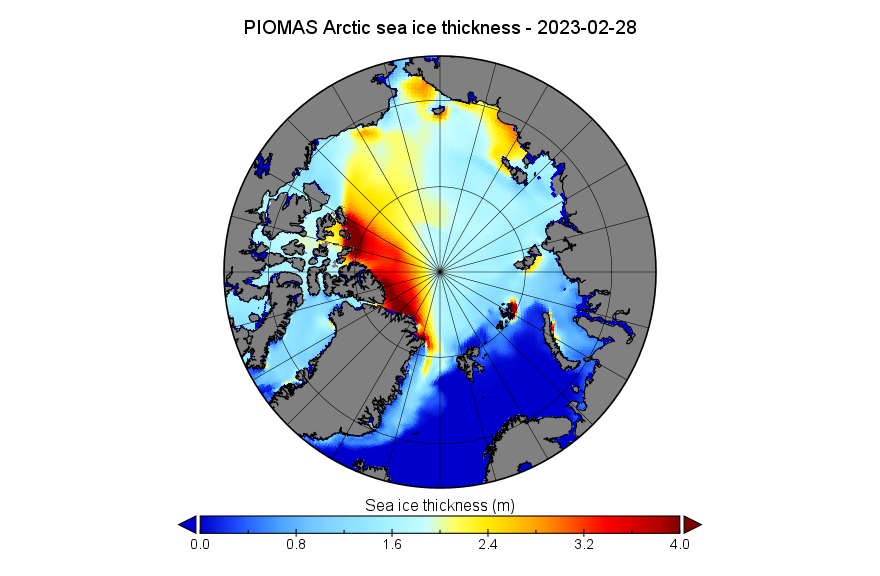
It reveals some of the thickest sea ice remaining in the Arctic Ocean taking the Fram Strait exit from the Central Arctic.
Since the “official” PIOMAS volume graph doesn’t seem to have been published yet, here too is one calculated from the gridded thickness data up to and including February 28th:

For comparison purposes here is the CryoSat-2/SMOS “measured” thickness map for the week ending March 6th:

Although the ice distribution is somewhat different to that of PIOMAS, this also shows an area of thicker ice at the northern entrance to the Fram Strait.
The near real time section of the CS2/SMOS volume graph suggests a recent slow down in the rate of volume increase:
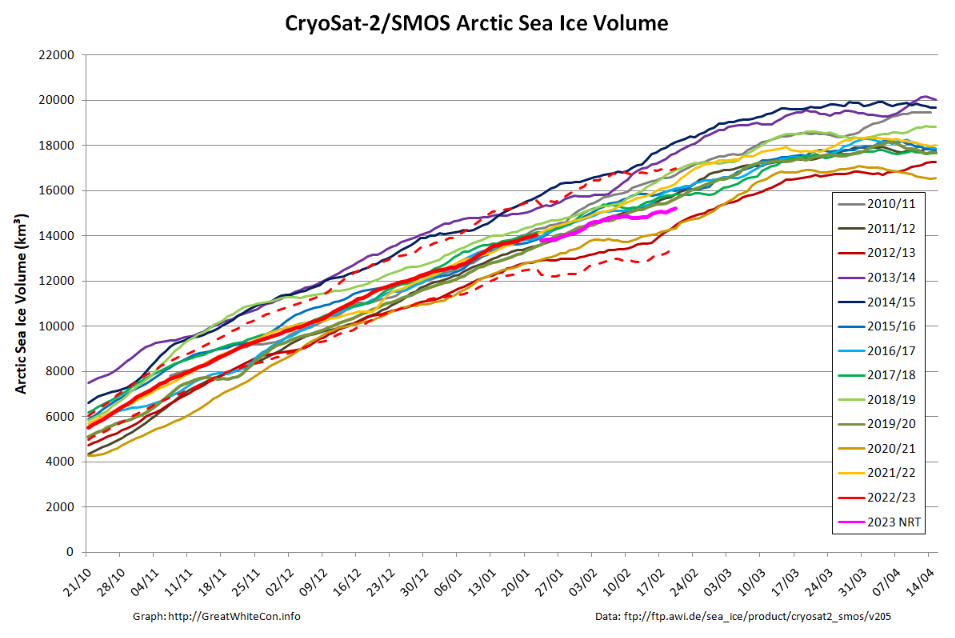
Note that the PIOMAS version of the graph doesn’t show the same slow down. Several weeks will need to elapse before we discover if the reanalysed CS2/SMOS data confirms it.
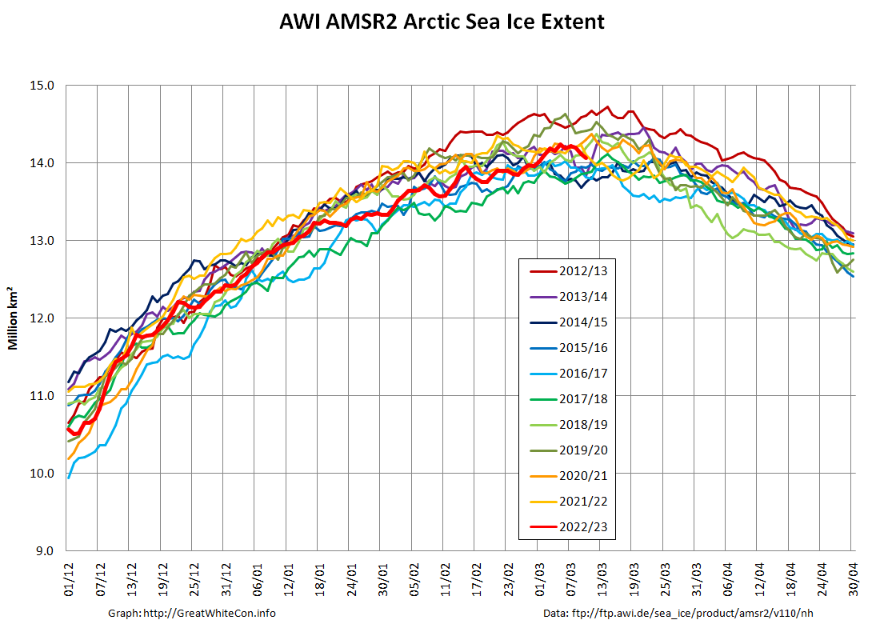
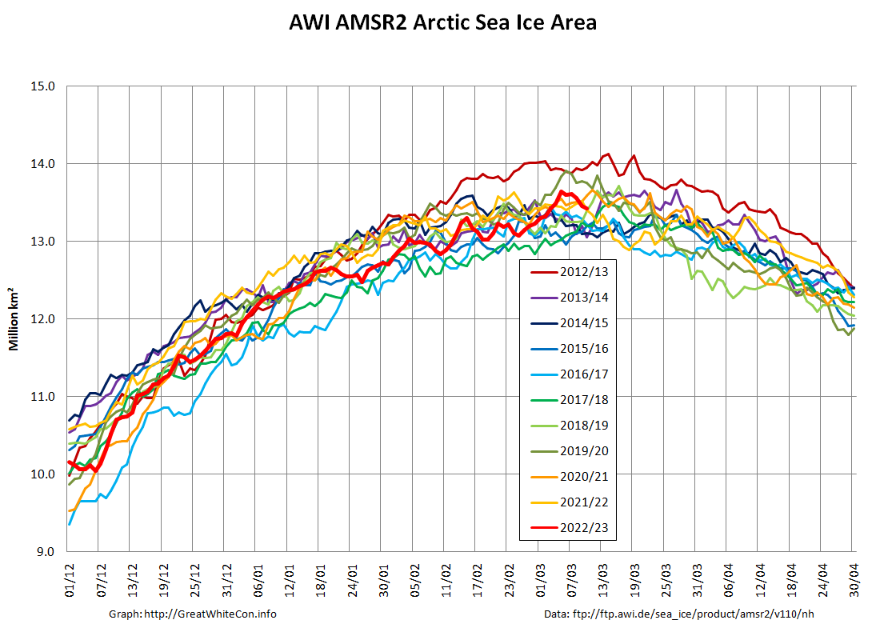
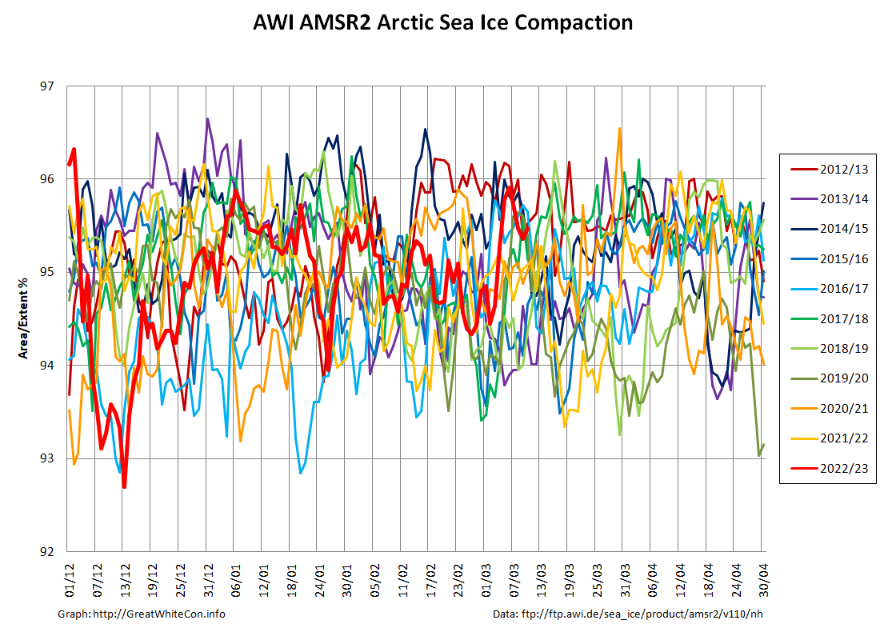
“Snow White” has called the 2023 maximum extent following NSIDC’s tumble yesterday. With only mild trepidation! More on some other extent metrics over on the 2023 Maximum Extent thread, but here is the current suite of graphs for our favourite “high resolution” AMSR2 based data from the Alfred Wegener Institute:
The latest thickness anomaly map from the Finnish Meteorological Institute still shows plenty of unusually thick ice waiting to be exported from the Central Arctic via the Fram Strait:

Watch this space!

