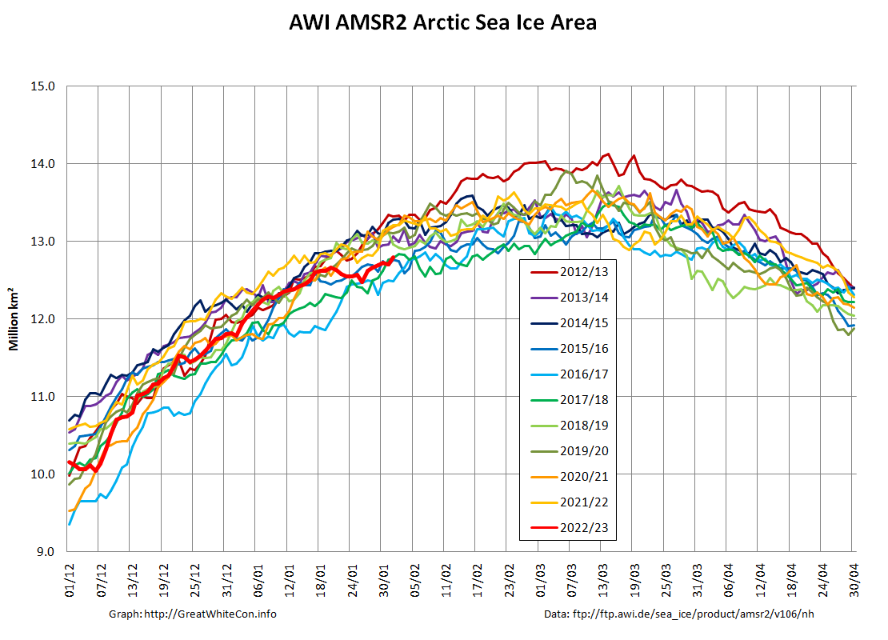
A new month has arrived, and during January several Arctic sea ice metrics have been drifting towards the bottom of their respective decadal ranges. To begin with here is AWI’s high resolution AMSR2 extent graph, which is currently very close to being lowest for the date in the AMSR2 record:

However that is less the case for area:
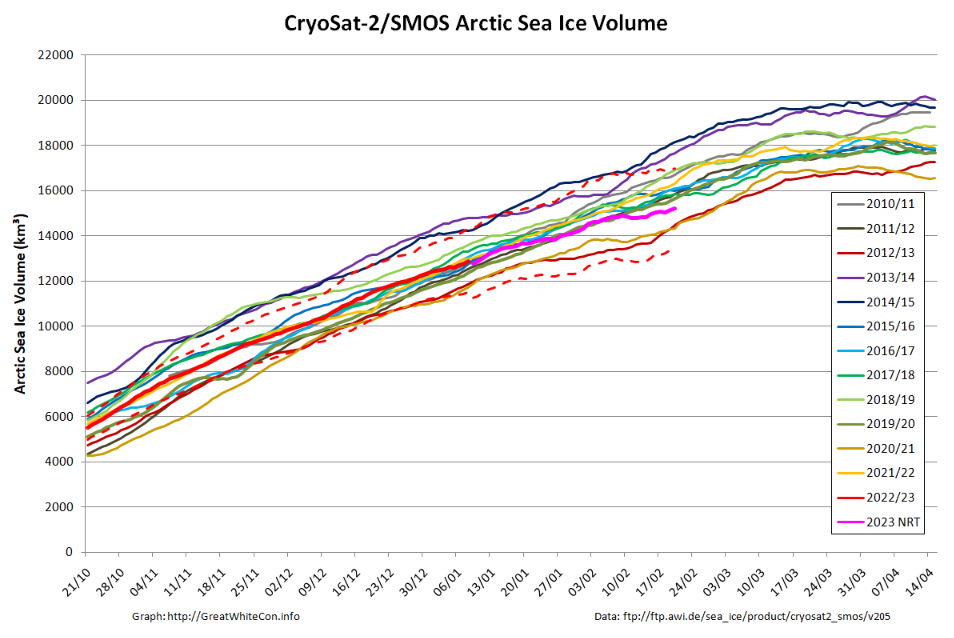
Taylor is keen to see the PIOMAS volume data for January, but whilst we wait for the latest Polar Science Center update here is the CryoSat-2/SMOS volume graph, which now includes a couple of month’s worth of reanalysed results as well as more recent near real time numbers:

Here too is the start of month CS2/SMOS thickness map:

There is still plenty of thicker ice queuing up for the Fram Strait exit from the Central Arctic.
Finally, for the moment at least, Northern Hemisphere snow cover is also very close to the bottom of its recent range at the moment:

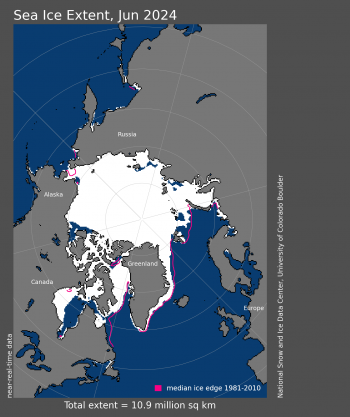
The latest edition of the NSIDC’s Arctic Sea Ice News has just been published:
The January 2023 average Arctic sea ice extent was 13.35 million square kilometers (5.15 million square miles), the third lowest January in the satellite record:

The sea level pressure pattern for January featured high pressure over the Pacific sector of the Arctic Ocean. This feature is known as the Beaufort High and is common in winter and spring:

By contrast, over on the Atlantic side of the Arctic, low pressure dominated in the Barents Sea region. As a result, relatively warm air from the south moved into the Barents Sea region, leading to air temperatures at the 925 millibar level (approximately 2,500 feet above the surface) more than 6 degrees Celsius above average near Svalbard:

Here too is an animation of sea ice motion on the Atlantic periphery for the winter of 2022/23 so far:
See in particular the waxing and waning of the area of open water north of Svalbard. Note also that the current GFS forecast includes a 944 hPa MSLP cyclone hovering over the Fram Strait tomorrow morning UTC:

The cyclone is already bringing temperatures above zero to Svalbard:

Measured temperatures in Svalbard did rise above freezing point on February 6th:

What’s more GFS is now forecasting yet another cyclonic blast, with MSLP down to 938 hPa at midnight tonight UTC:

The PIOMAS gridded thickness data for January has now been released, so here’s the January 31st “modelled” thickness map. Compare and contrast with the CryoSat-2 “measured” thickness map above:

Here too is the associated daily volume graph, which now shows 2023 as 6th lowest for the date in the satellite record:
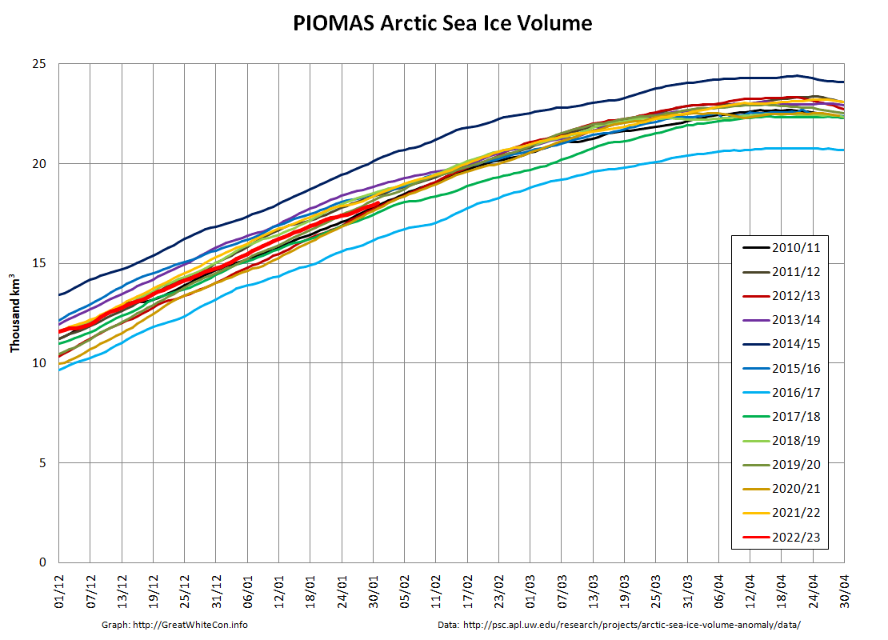
The PIOMAS page on the Polar Science Center web site has also been updated:
Average Arctic sea ice volume in January 2023 was 16,500 km3. This value is the 7th lowest on record for January, about 1,900 km3 above the low record set in 2017. Monthly ice volume was 40% below the maximum in 1979 and 22% below the mean value for 1979-2022. Average January 2023 ice volume was 1.1 standard deviations above the 1979-2022 trend line.
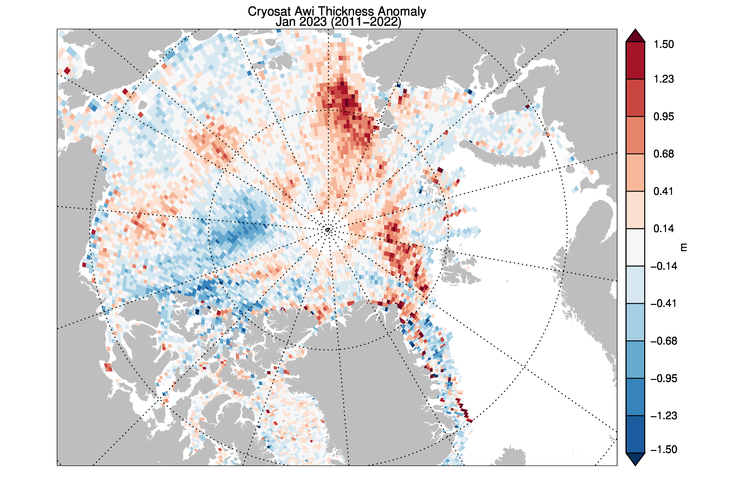
The ice thickness anomaly map for January 2023 relative to 2011-2022 shows positive anomalies north of Greenland and along the Canadian Archipelago. Positive anomalies are area also present in the Eurasian sector of the Arctic with particularly thick ice near Severnaya Zemlya:

CryoSat 2 satellite-derived ice thickness maps show a weaker anomaly north of Greenland and along the Canadian Archipelago but they are narrowly confined to the near the coast (note that CS2 is a monthly composite rather than an average):
Especially for Taylor, the PSC also states that:
The January time series for both data sets agree within the estimated uncertainty have no apparent trend over the past 12 years. Comparing this with the 43 year 1979-2023 time series highlights the importance of natural variability in relatively short time series such as currently available from CS2 (see our recent paper). Both records show close match in magnitude and similar temporal variability:

If you can excuse the brief excursion down under, according to JAXA ViSHOP AMSR2 based sea ice extent around Antarctica has reached a record all time low for the satellite era:
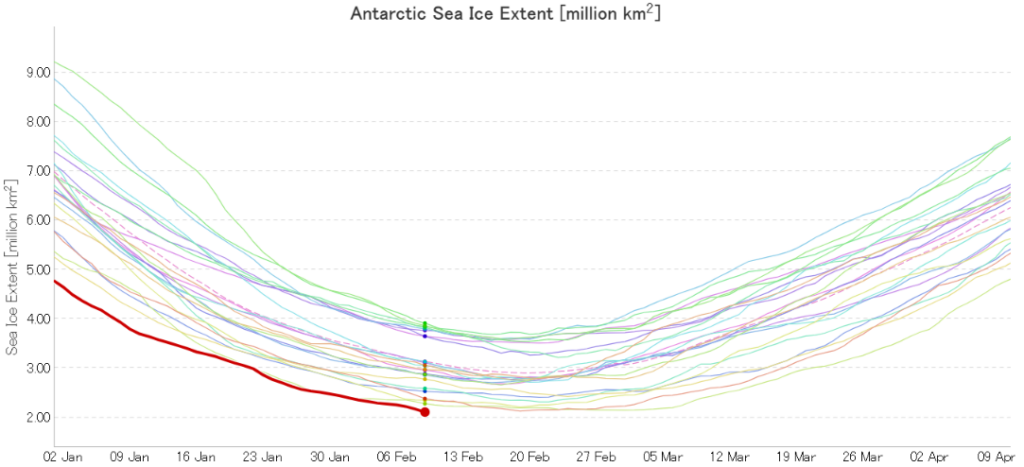
Currently 2.11 million km², with a week or two still remaining in the 2023 southern hemisphere sea ice melting season.
P.S. The Alfred Wegener Institute have now issued a lengthy press release about the new record, which you can read all about over here:
“New Record Antarctic Sea Ice Minimum Extent“
Back in the Arctic, there has been a sudden drop in JAXA extent over the past couple of days:

This animation of recent ice motion on the Atlantic periphery suggests the decline was caused by the recent cyclones:

As a consequence JAXA global extent is now at a record low level for the satellite era.
According to the CMC another in the apparently never ending sequence of “Fram Strait cyclones” bottomed out with an MSLP of 968 hPa at 6 AM UTC today:
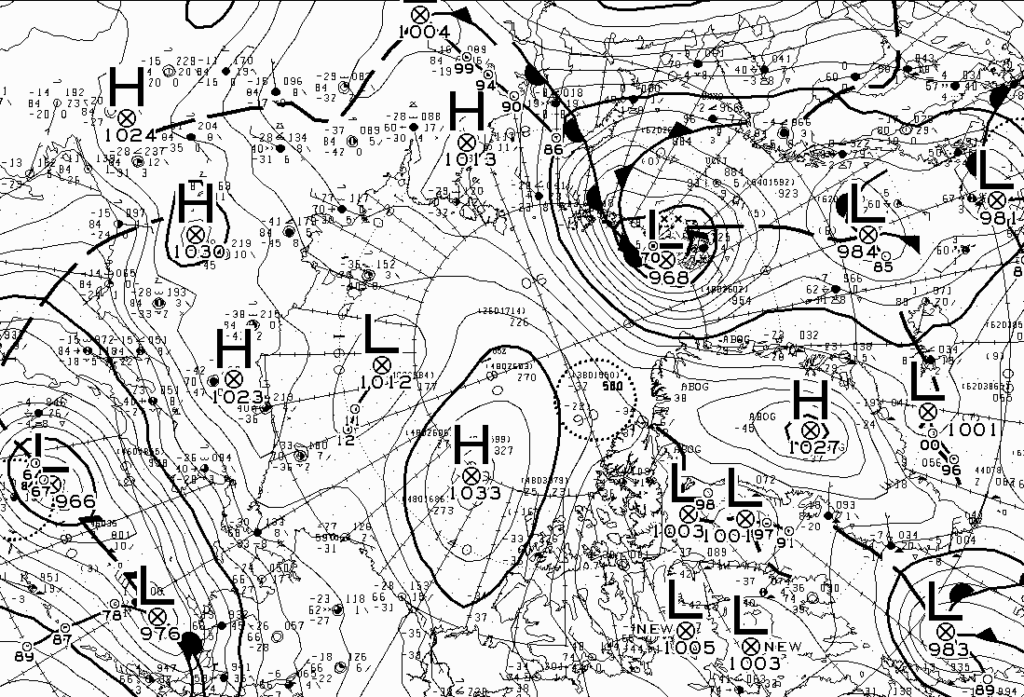
The mid month PIOMAS gridded thickness data has just been released, so here is the modelled thickness map for February 15th:
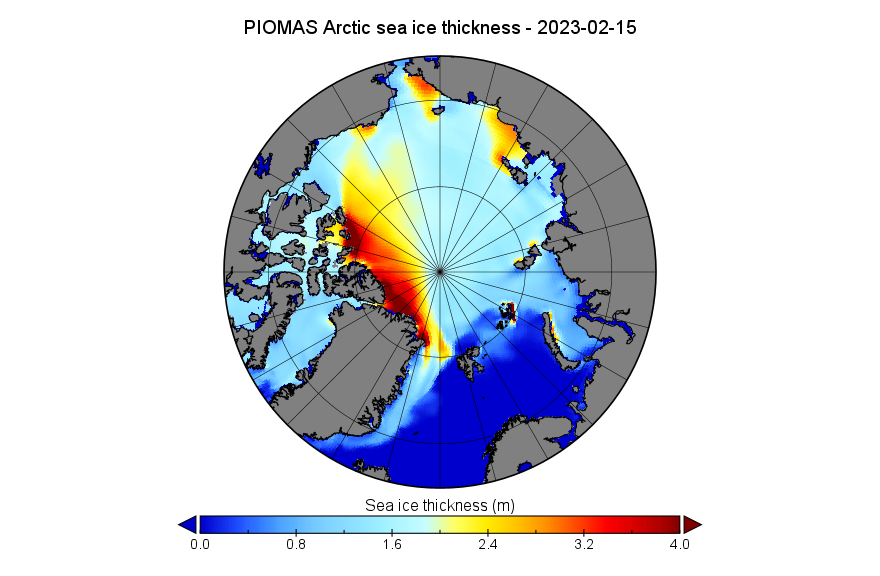
together with the PIOMAS volume graph up to February 15th:

For comparison purposes here is the CryoSat-2/SMOS merged thickness map for February 15th:
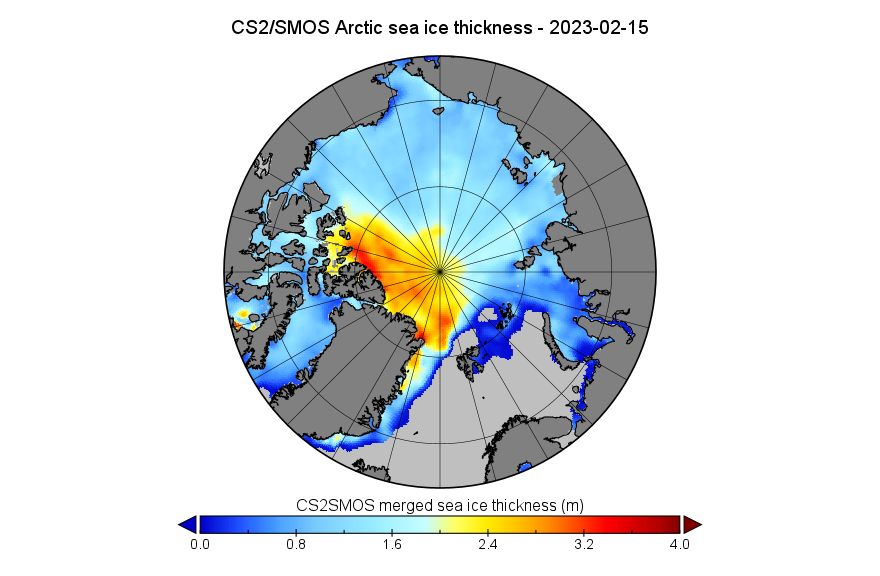
Here too is the latest CryoSat-2/SMOS volume graph, updated with near real time data to February 20th:
The conversation has now moved to the March open thread.


