Dr. Judah Cohen from Atmospheric and Environmental Research (AER) embarked on
an experimental process of regular research, review, and analysis of the Arctic
Oscillation (AO) and Polar Vortex (PV). This analysis is intended to provide researchers
and practitioners real-time insights on one of North America’s and Europe’s leading
drivers for extreme and persistent temperature patterns.
During the winter schedule the blog is updated once every week. Snow accumulation
forecasts replace precipitation forecasts. Also, there is renewed emphasis on ice and
snow boundary conditions and their influence on hemispheric weather. In late Spring,
we transition to a spring/summer schedule, which is once every two weeks. Snow
accumulation forecasts will be replaced by precipitation forecasts. Also, there will be
less emphasis on ice and snow boundary conditions and their influence on hemispheric weather.
Subscribe to our email list or follow me on Twitter (@judah47) for notification of updates.
The AO/PV blog is partially supported by NSF grant AGS: 1657748
Summary
- The Arctic Oscillation (AO) is currently negative and is predicted to trend positive the next two weeks as pressure/geopotential height anomalies across the Arctic are currently mostly positive and are predicted to become increasingly mixed to negative over the next two weeks. The North Atlantic Oscillation (NAO) is currently negative with strongly positive pressure/geopotential height anomalies across Greenland and the NAO is predicted to also trend positive the next two weeks as pressure/geopotential height anomalies are predicted to remain positive to neutral across Greenland.
- This week ridging/positive geopotential height anomalies across Greenland will support troughing/negative eopotential height anomalies centered on Western Europe. Then next week as troughing overspreads Greenland, ridging will overspread Europe. This pattern will support this week normal to below normal temperatures across Northern and Western Europe including the United Kingdom (UK) while induced southwesterly flow will support normal to above normal temperatures across Southeastern Europe. Then next week normal to above normal temperatures will become more widespread across Europe.
- The general pattern predicted for Asia the next two weeks is ridging/positive geopotential height anomalies centered over the Urals forcing troughing/negative geopotential height anomalies across Central Asia with more ridging centered across East Asia. This pattern favors this week normal to above normal temperatures across much of Asia with normal to below normal temperatures limited to Siberia and Kazakhstan, however next week the colder temperatures are predicted to spread into East Asia.
- This general predicted pattern across North America is troughing/negative geopotential height anomalies in the Gulf of Alaska forcing ridging/positive geopotential height anomalies across the interior of North America. This pattern favors widespread normal to above normal across much of Canda and the United States (US) with normal to below normal temperatures limited to Southeastern Canada and the US East Coast.
- In the Impacts section I discuss the polar vortex and what might be its next move and its potential influence on the weather in the Northern Hemisphere (NH).
Plain Language Summary
The Greenland blocking/high pressure) that brought cooler weather to Western and Northern Europe is abating (see Figure 5) and should allow for a warmup for Europe (see Figure 9). Meanwhile low pressure troughing in the Gulf of Alaska is persisting the mild pattern across much of Canada and the US (see Figure 6). But the polar vortex is predicted to stretch (see Figure i) and this will likely usher in some cooler weather for the US East Coast next week (see Figure 6). What happens next for the polar vortex is highly uncertain.
Impacts
As I have noted and others the Northern Hemisphere (NH) polar vortex (PV) has been unusually weak, near or at record weak, all of September and even into October. It does seem to me that the climax of this overall weak PV will be a stretched PV next week (see Figure i). The stretched PV in my opinion is related to the cooler temperatures forecsasted for the US East Coast but it is still very early and this is not an impressive event. Reninds me of last witner when stretched PV events where focused pretty far east with much of the cold air simply spilling out into the North Atlatnic Ocean.

Figure i. Observed 10 mb geopotential heights (dam; contours) and
geopotential height anomalies (m; shading) across the Northern Hemisphere from
13 – 17 October 2024.
After that the PV will likely strengthen as is often the case with stretched PVs. The steched PV of next week could be followed up by another stretched PV or even a Canadian warming, that is what the GFS is suggesting. A Canadian warming does favor colder temperatures in Siberia but very mild temperatures in much of North America. I think the predicted persistence of high pressure ridging near the Urals (see Figure 8) favors some kind of perturbed PV but for now another stretched PV, a Canadian Warming or a strong quasi circular PV are all plausible solutions.
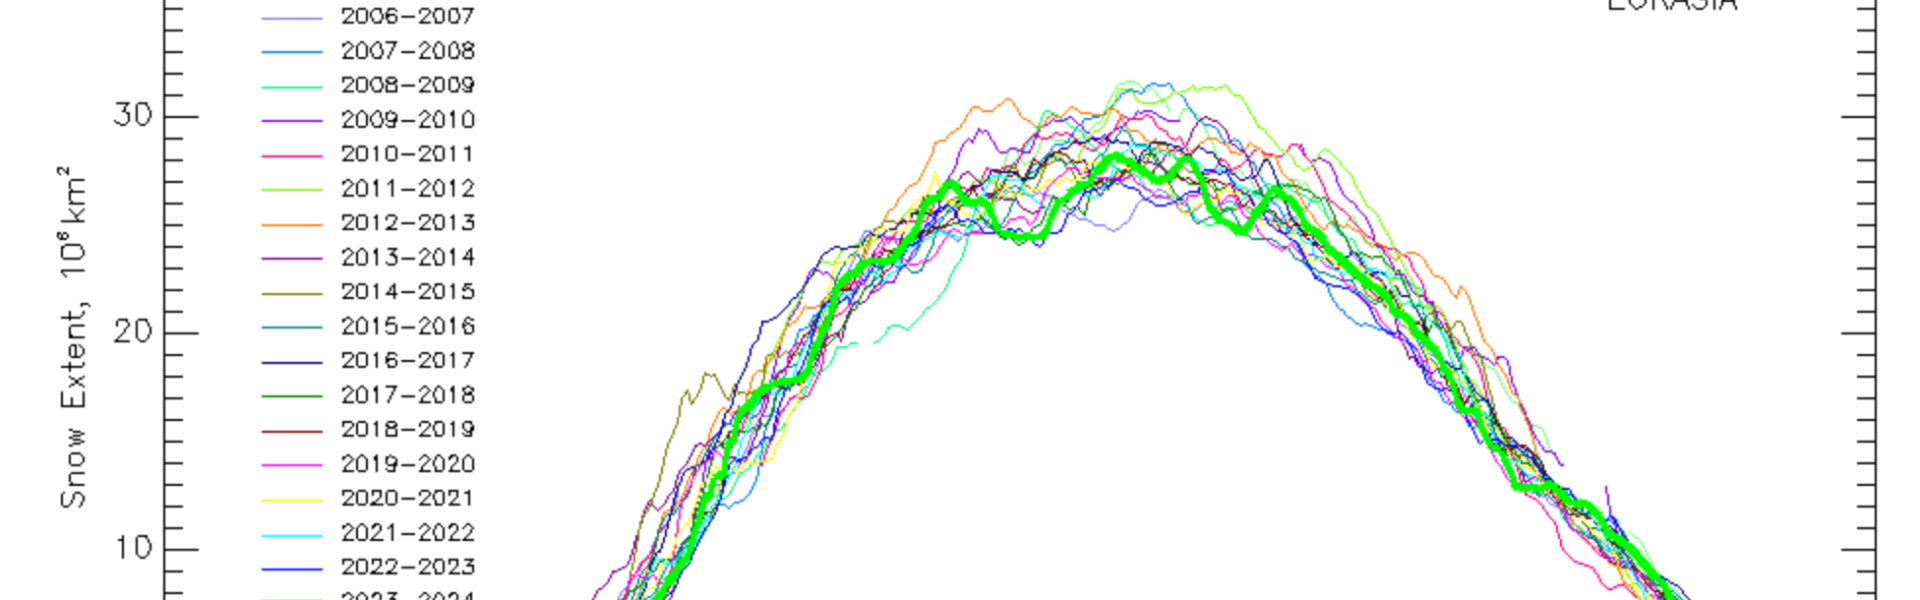
Of course it is October and I am fiocused on Siberian snow cover. Much of September and now into October the NAO has been strongly negative with impressive Greenland blocking. I thought that therefore the Siberian snow season might start out of the gate like gangbusters but so far I have been underwhelmed. The snow cover extent is quite similar to last October on this date and certainly clustered with most of the recent Octobers but looks to be on the lighter side of the past decade or so (see Figure ii). I will try to plot my own version later this week and tweet it out and incldue in future blog updates.

Figure iii. Figure 19. Observed Eurasian snow cover extent through 6 October 2024. Image source: https://www.star.nesdis.noaa.gov/smcd/emb/snow/HTML/snow_extent_monitor.html
The negative NAO and Greenland blocking that has been around for most of the fall is predicted to wane (e.g., see Figure 5). That could slow down an already anemic month of snow cover advance. However the forecasts for later this month include Ural blocking that is also conducive to snow cover advance across Siberia and the forecast plots of predicted snowfall look failry healthy (see for example Figure iii). I think the smart money is on that this year October Siberian snow cover extent will come close to the past four Octobers at slightly above normal that really doesn’t signify a strong signal.

Figure iii. Forecasted snow depth changes (mm/day; shading) from 13 – 17 October 2024. The forecast is from the 00Z 31 January 2022 GFS ensemble.
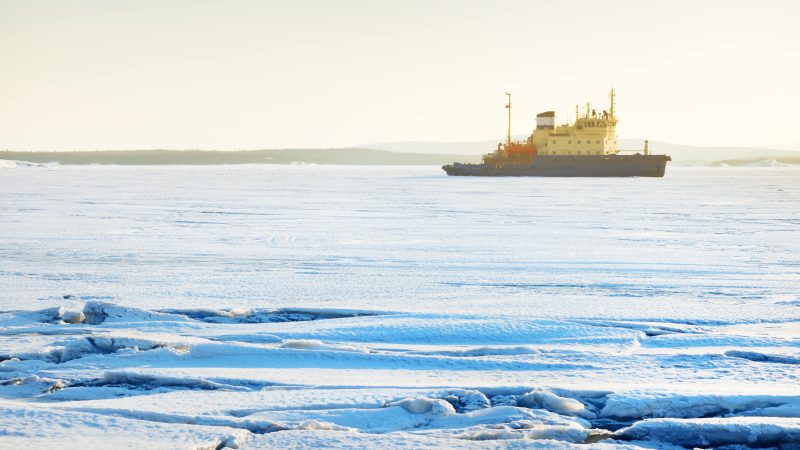
Finally Arctic sea ice extent put in a minimum for the year and is starting to grow but slowly for now. Sea ice extent is currently low all around the Arctic with no preferred regions (see Figure iv). It is the lack of sea ice in the Barents Kara Seas that faovrs a weak PV. So we will just have to wait to see which region emerges as the clear loser in sea ice extent later this fall and into early winter.

Figure iv. Observed Arctic sea ice extent on 6 October 2024 (white). Orange line shows climatological extent of sea ice based on the years 1981-2010. Image from the National Snow and Ice Data Center (NSIDC). URL: https://nsidc.org/sea-ice-today
Near-Term
This week
The AO is predicted to be negative this week (Figure 1) with mostly positive geopotential height anomalies across the Arctic and with mixed geopotential height anomalies across the mid-latitudes of the NH (Figure 2). With predicted strongly positive geopotential height anomalies across Greenland (Figure 2), the NAO is predicted to be strongly negative this week.

Figure 1. The predicted daily-mean AO at 1000 hPa from the 00Z 7
October 2024 GFS ensemble. Gray lines indicate the AO index from each individual
ensemble member, with the ensemble-mean AO index given by the red line with
squares.
This week, ridging/positive geopotential height anomalies across Greenland will support troughing/negative eopotential height anomalies centered on Western Europe this week (Figures 2). This pattern will favor normal to below normal temperatures across Northern and Western Europe including the UK while induced southwesterly flow favors normal to above normal temperatures across Southern and Eastern Europe (Figure 3). This week the predicted pattern across Asia is ridging/positive geopotential height anomalies centered over Wester Asia forcing troughing/negative geopotential height anomalies across Central Asia with more ridging across East Asia (Figure 2). This pattern favors normal to above normal temperatures across Southern Asia with normal to below normal temperatures across Northern Asia but primarily Siberia (Figure 3).

Figure 2. Forecasted average 500 mb geopotential heights (dam; contours) and
geopotential height anomalies (m; shading) across the Northern Hemisphere from 8 – 12 October 2024. The forecasts are from the 00z 7 October 2024 GFS ensemble.
This week troughing/negative geopotential height anomalies in the Gulf of Alaska, will force ridging/positive geopotential heights across the interior of North America with the exception of troughing in Southeastern Canada and the Northeastern US (Figure 2). This pattern will favor normal to above normal temperatures across eastern Alaska, much of Canada and the US with normal to below normal temperatures limited to Southeastern Canada and the US East Coast (Figure 3).

Figure 3. Forecasted surface temperature anomalies (°C; shading) from 8 – 12 October 2024. The forecast is from the 00Z 7 October 2024 GFS ensemble.
Troughing will support above normal rainfall across the Northern and Western Europe, parts of Siberia, the Tibetan Plateau and parts of India with normal to below normal rainfall elsewhere across Eurasia this week (Figure 4). Troughing will support above normal rainfall across Southern Alaska, the Canadian Maritimes, and Florida due to Hurricane Milton with normal to below normal rainfall across the remainder of North America this week (Figure 4).

Figure 4. Forecasted precipitation rate (mm/day; shading) from 8 – 12 October 2023.
The forecast is from the 00Z 7 October 2023 GFS ensemble.
Near-Mid Term
Next week
With geopotential height anomalies turning more mixed across the Arctic and with mixed geopotential height anomalies across the mid-latitudes this period (Figure 5), the AO will likely turn neutral this period (Figure 1). With predicted mixed pressure/geopotential height anomalies across Greenland (Figure 5), the NAO will likely be persist slightly negative to neutral this period.

Figure 5. Forecasted average 500 mb geopotential heights (dam; contours) and
geopotential height anomalies (m; shading) across the Northern Hemisphere from 13 – 17 October 2024. The forecasts are from the 00z 7 October 2024 GFS ensemble.
Weakening ridging/positive geopotential height anomalies across Greenland will continue to support troughing/negative geopotential height anomalies across Europe this period albeit weakening (Figure 5). This pattern will favor normal to below normal temperatures across much of Europe including the UK with normal to above normal temperatures across Southern Europe (Figures 6). The predicted pattern across Asia is ridging/positive geopotential height anomalies centered over the Urals forcing troughing/negative geopotential height anomalies across Central Asia extending across Siberia with more ridging/positive geopotential height anomalies across Far East Asia (Figure 5). This pattern favors normal to above normal temperatures across all of Western, Southern and East Asia with normal to below normal temperatures across much of Siberia and Kazakhstan (Figure 6).

Figure 6. Forecasted surface temperature anomalies (°C; shading) from 13 – 17 October 2024. The forecasts are from the 00z 7 October 2024 GFS ensemble
Persistent troughing/negative geopotential height anomalies in the Gulf of Alaska will force ridging/positive geopotential height anomalies across most of Canada and the US with the exception of troughing in Southeastern Canada and the US East Coast this period (Figure 5). This pattern will favor normal to above normal temperatures across Alaska, most of Canada and the US with normal to below normal temperatures limited to Southeastern Canada and the US East Coast (Figure 6).

Figure 7. Forecasted precipitation rate (mm/day; shading) from 13 – 17
October 2024. The forecasts are from the 00z 7 October 2024 GFS ensemble.
Troughing will support above normal rainfall across Spain, Eastern Siberia, and parts of East Asia with normal to below normal rainfall elsewhere across Eurasia this period (Figure 7). Troughing will support above normal rainfall across southeastern Alaska and the West Coast of Canada with normal to below normal rainfall across the rest of North America this period (Figure 7).
Mid Term
Week Two
With predicted med to negative geopotential height anomalies across the Arctic and mixed geopotential height anomalies across the mid-latitudes this period (Figure 8), the AO will likely persist near neutral to positive this period (Figure 1). With predicted mixed to negative pressure/geopotential height anomalies across Greenland (Figure 8), the NAO will likely be neutral this period.

Figure 8. Forecasted average 500 mb geopotential heights (dam; contours) and
geopotential height anomalies (m; shading) across the Northern Hemisphere from 18 – 22
October 2024. The forecasts are from the 00z 7 October 2024 GFS ensemble.
Increasing troughing/negative geopotential height anomalies across Greenland will now support ridging/positive geopotential height anomalies across much of Europe this period (Figure 8). This pattern should favor widespread normal to above normal temperatures across Europe including the UK this period (Figures 9). The predicted pattern across Asia this period is ridging/positive geopotential height anomalies centered on the Urals and the Barents-Kara Seas forcing troughing/negative geopotential height anomalies across Siberia and Eastern Asia this period (Figure 8). The predicted pattern favors widespread normal to above normal temperatures across Western and Southern Asia with normal to below normal temperatures widespread across Siberia and East Asia this period (Figure 9).

Figure 9. Forecasted surface temperature anomalies (°C; shading) from 18 – 22 October 2024. The forecast is from the 00Z 7 October 2024 GFS ensemble.
Predicted persistent troughing/negative geopotential height anomalies across Alaska and the Gulf of Alaska will force ridging/positive geopotential height anomalies across most of Canada and the US (Figure 8). This pattern will favor normal to below normal temperatures across southern Alaska, the West Coast of Canada, the US Pacific Northwest and parts of the Southeastern US with widespread normal to above normal temperatures across much of northern Alaska, Canada and the US (Figure 9).

Figure 10. Forecasted precipitation rate (mm/day; shading) from 18 – 22 October 2024.
The forecast is from the 00Z 7 October 2024 GFS ensemble
Troughing will support above normal rainfall across the Mediterranean region, Tibetan Plateau, India and East Asia with normal to below normal rainfall elsewhere across Eurasia this period (Figure 10). Troughing will support above normal rainfall for parts of Alaska and the West Coast of Canada with normal to below normal rainfall across the remainder of North America this period (Figure 10).
Longer Term
30–day
The latest plotof the polar cap geopotential height anomalies (PCHs) currently shows warm/positive PCHs through much of the stratosphere and tropospherewith the exception of cold/negative PCHs in the upper stratosphere (Figure 11). Then next warm/positive PCHs will persist in the stratosphere and upper troposphere but weaken and reverse to cold/negative in the lower troposphere and surface (Figure 11).

Figure 11. Observed and predicted daily polar cap height (i.e., area-averaged
geopotential heights poleward of 60°N) standardized anomalies. The forecast is from the 00Z 7 October 2024 GFS ensemble.
The predicted warm/positive PCHs near the surface this week (Figure 11) are consistent with the predicted negative surface AO this week (Figure 1). However, next week when the PCHs in the lower troposphere are predicted to trend cold/negative, this will force a period of a more neutral to positive AO next week.

Figure 12. Forecasted average 500 mb geopotential heights (dam; contours) and
geopotential height anomalies (m; shading) across the Northern Hemisphere for
October 2024. The forecasts are from the 00Z 7 October 2024 CFS.
I include in this week’s blog the monthly 500 hPa geopotential heights (Figure 12) and surface temperatures for November (Figure 13) from the Climate Forecast System (CFS; the plots represent yesterday’s four ensemble members). The forecast for the troposphere is ridging across Baffin Bay and Greenland, Eastern Asia, the Aleutians and much of Canada and the US with troughing across Western Asia, Siberia, Alaska, the Gulf of Alaska and the Eastern US (Figure 12). This pattern favors seasonable to relatively warm temperatures across Europe, Southern and Eastern Asia, northern Alaska much of Canada and the US with seasonable to relatively cool temperatures for parts of Central Asia, parts of Siberia, Northeast Asia, southern Alaska, the West Coast of Canada and parts of the US East Coast (Figure 13).

Figure 13. Forecasted average surface temperature anomalies (°C; shading) across
the Northern Hemisphere for October 2024. The forecasts are from the 00Z 7 October 2024 CFS.
Boundary Forcings
SSTs/El Niño/Southern Oscillation
Equatorial Pacific sea surface temperatures (SSTs) anomalies are below normal, between the Dateline and the South America coast, indicating that an La Niña is emerging (Figure 14) and weak La Niña conditions are expected through the winter. Observed SSTs across the NH remain well above normal especially in the central North Pacific centered on teh Dateline and the western North Pacific, much of the North Atlantic and offshore of eastern North America though below normal SSTs exist regionally especially in the South Pacific.

Figure 14. The latest daily-mean global SST anomalies (ending 6 October 2024).
Data from NOAA OI High-Resolution dataset. Source: https://psl.noaa.gov/map/clim/sst.shtml
Madden Julian Oscillation
Currently the Madden Julian Oscillation (MJO) is weak where no phase is favored (Figure 1). The forecasts are for the MJO to reamin weak where no phase is favored and then possibly emerge in phase six in two weeks. Therefore it seems that the MJO is having limited influence on North American weather next week. But admittedly this is outside of my expertise.

Figure 15. Past and forecast values of the MJO index. Forecast values from the 00Z 7 October 2024 ECMWF model. Yellow lines indicate individual ensemble-member
forecasts, with the green line showing the ensemble-mean. A measure of the model
“spread” is denoted by the gray shading. Sector numbers indicate the phase of the
MJO, with geographical labels indicating where anomalous convection occurs during
that phase. Image source: https://www.cpc.ncep.noaa.gov/products/precip/CWlink/MJO/CLIVAR/ecmf.shtml
Get Detailed Seasonal Weather Intelligence with sCast
We appreciate your taking the time to read the public Arctic Oscillation blog from Dr. Judah Cohen and the AER Seasonal Forecasting team.
Dr. Cohen’s detailed monthly seasonal forecast, sCast, is also available for purchase. sCast provides a monthly 30-60-90-180-day outlook into temperature and precipitation, solar flux and wind anomalies across the globe, and regional population weighted cooling and heating degree forecasts for the US.
Our sCast principal engineer, Karl Pfeiffer, can help you use sCast and other AER seasonal forecast products to deliver important, long-lead time weather intelligence to your business. Please reach out to Karl today!