A new month is upon us and Christmas is coming! Here’s another look at Lars Kaleschke’s high resolution AMSR2 area and extent graphs for the Arctic as a whole:


Extent increase stalled for the last few days of November, and as a result extent is now in a “statistical tie” with 2017 for 4th lowest extent for the date in the AMSR2 record.
The AMSR2 concentration map reveals that the Chukchi Sea is now mostly refrozen:

However over on the Atlantic side of the Arctic there is now more open water than average in the Barents Sea:

After a rapid rise at the start of November extent in the Kara Sea has barely increased over the last two weeks:

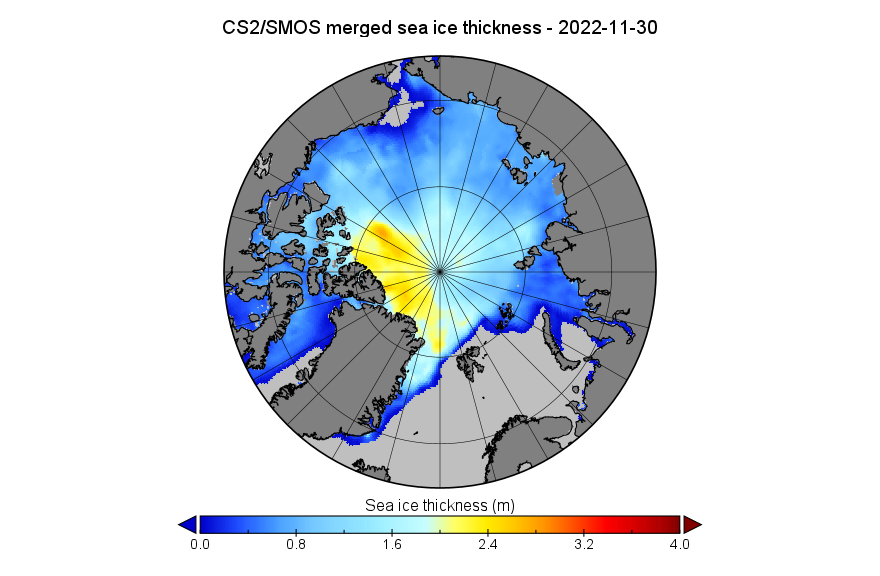
Looking at the third dimension next, here is the latest AWI CryoSat-2/SMOS Arctic sea ice thickness map:

Rather than piled up along the north coasts of Greenland and Ellesmere Island as in days gone by, the thickest remaining ice currently appears to be in the Central Arctic north-west of the Canadian Arctic Archipelago.
Finally, for the moment at least, here is the latest CS2/SMOS volume graph:

News via the ASIF of a recent journal article discussing the “Great Arctic Winter Cyclone” of 2022. In a paper entitled “Record Arctic Cyclone of January 2022: Characteristics, Impacts, and Predictability” Ed Blanchard-Wrigglesworth et al. point out that:
The cyclone resulted in a record (over the period 1979–2022) weekly loss of regional sea ice area and surface wind speeds, and generated ocean waves exceeding 8 m that impinged on sea ice in the Barents sea, observed via satellite altimetry as large waves-in-sea ice up to 2 m in amplitude more than 100 km into the ice pack. Surface heat fluxes were strongly impacted by the cyclone, with record atmosphere-to-surface turbulent fluxes. However, the direct atmospheric thermodynamic impact on sea ice loss was modest, and the record sea ice changes were likely mainly driven by dynamical and/or ocean processes. While the storm was well predicted up to 8 days in advance, subsequent changes in sea ice cover were not, likely due to biases in the forecasts’ sea ice initial conditions and missing physics in the forecast model such as wave-sea ice interaction.

PIOMAS Arctic sea ice volume and thickness data for November 2022 has been released:
Average Arctic sea ice volume in November 2022 was 9,700 km3. This value is the 10th lowest on record for November, about 1,900 km 3 above the low record set in 2016. Monthly ice volume was 51% below the maximum in 1979 and 32% below the mean value for 1979-2021. Average November 2022 ice volume was 1.4 standard deviations above the 1979-2021 trend line…

The ice thickness anomaly map for November 2022 relative to 2011-2020 shows further strengthening of the positive anomalies north of Greenland and along the Canadian Archipelago:

Here too is the “unofficial” thickness map derived from the gridded thickness data:

Note the traditional build up of ice along the northern coast of the Canadian Arctic Archipelago which is absent from this CryoSat-2/SMOS thickness map:

The 2022 edition of NOAA’s Arctic Report Card has just been published. Here’s an introductory video:
According to the accompanying press release:
Arctic annual air temperatures from October 2021 to September 2022 were the sixth warmest dating back to 1900, continuing a decades-long trend in which Arctic air temperatures have warmed faster than the global average. The Arctic’s seven warmest years since 1900 have been the last seven years:

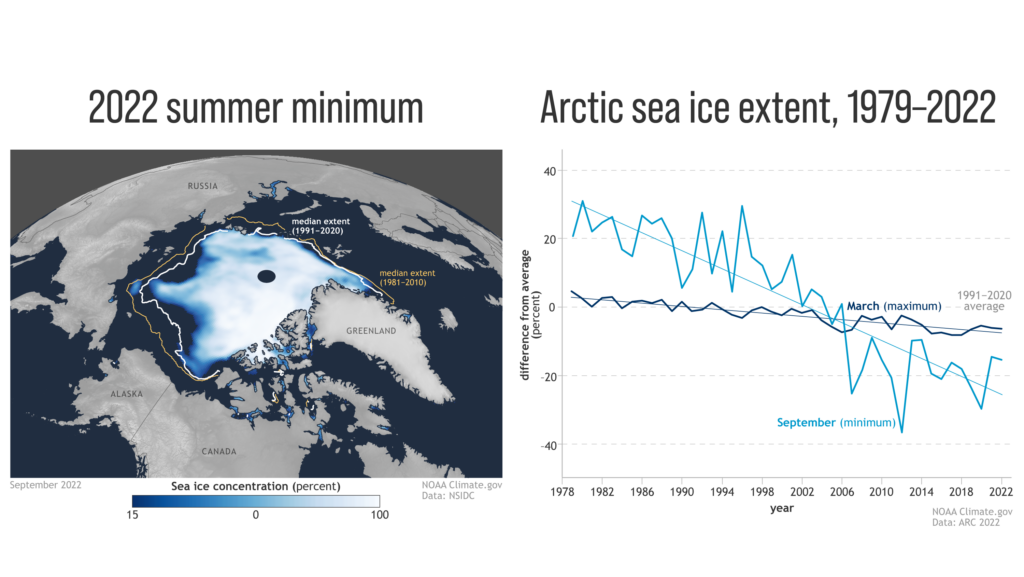
Arctic sea ice extent (coverage) was higher than many recent years, but much lower than the long-term average. Multiyear ice extent, sea-ice thickness and volume rebounded after a near-record low in 2021, but was below conditions in the 1980s and 1990s, with older ice extremely rare. Open water developed near the North Pole for much of the summer, allowing polar-class tourist and research vessels easy access. The Northern Sea Route and Northwest Passage were also largely open…

The 2021-2022 Arctic snow season saw a combination of above-average snow accumulation but early snowmelt, consistent with long-term trends of shortening snow seasons in several areas.
Wetter-than-normal conditions predominated over much of the Arctic from October 2021 to September 2022. Precipitation has increased significantly since the 1950s across all seasons and datasets. Heavy precipitation events are more common in the North Atlantic subarctic, while much of the central Arctic shows increases in consecutive wet days and decreases in consecutive dry days…
The Greenland ice sheet lost ice in 2022, the 25th consecutive year of ice loss. In September 2022, the Greenland ice sheet had unprecedented late-season warming, creating surface melt conditions over 36% of the ice sheet on September 3, including the Greenland ice sheet’s summit at 10,500 feet. This followed a July 18 large surface melt event observed across 42% of the Greenland ice sheet surface.
The August 2022 sea surface temperatures continued to show a warming trend that has been observed since 1982 for much of the ice-free Arctic Ocean. In the Barents and Laptev seas, August 2022 mean sea surface temperatures were 3.5 to 5.5 degrees Fahrenheit (2 to 3°C) warmer than 1991–2020 August mean values while unusually cool August sea surface temperatures of 5.4 degrees Fahrenheit (3 degrees Celsius) below the trend occurred in the Chukchi Sea, likely driven by late-summer sea ice in the region that was kept in place by the winds.
According to FlightRadar24 Santa Claus has recently completed his final deliveries to Alaska:

In other news from the far north here’s the mid December PIOMAS Arctic sea ice thickness map:

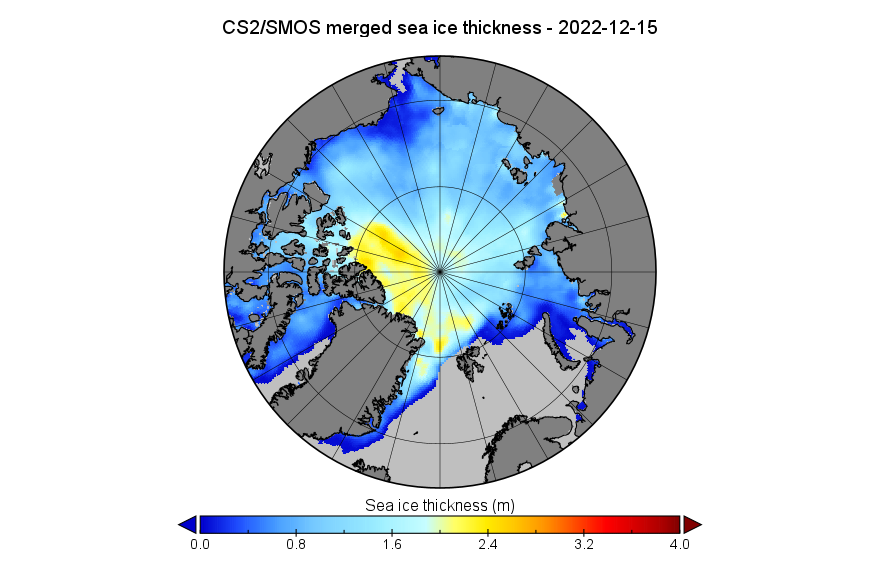
together with the CryoSat-2/SMOS equivalent:

CryoSat continues to show significantly thinner ice than PIOMAS in the area north of Greenland and the CAA. It does however reveal some thicker ice north of Svalbard.
Further news is now available on the January 2023 open thread.


