SHARE YOUR SCIENCE: The loss of summer Arctic sea ice has become the «canary in the coalmine» of climate change. Sea ice is also declining during the dark, cold winter, but more ice was observed this winter than in the previous 10 years. A new PhD thesis helps to understand why.

A hundred years ago, in 1893, Fridtjof Nansen and his crew froze the Fram into the sea ice and drifted across the Arctic. During the expedition, they experienced sea ice that was sometimes more than 10 meters thick, and the ice rafts were so high that they would spill onto the deck. It took the ship three full years to drift from the Russian Arctic to Svalbard.
Inspired by the Fram expedition, the German research icebreaker Polarstern set sail from Tromsø in September 2019, aiming to spend a year drifting through the Arctic Ocean in what was called the MOSAiC expedition. The Polarstern and its crew found a very different Arctic Ocean.
Due to the lack of thick sea ice, it was very difficult to find a stable enough floe of ice that would support the expedition. Due to the thinner and more mobile ice pack, it only took around 9 months to drift across the Arctic.
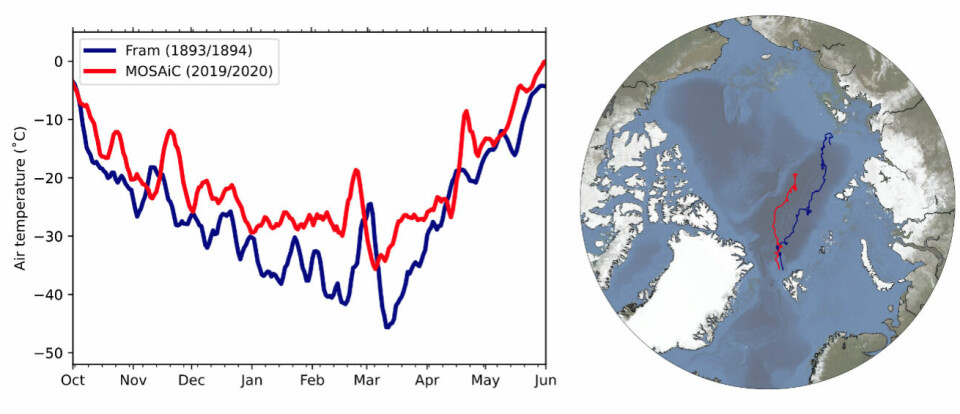
When comparing the air temperature during the two expeditions, the atmosphere was about 6˚ C warmer during MOSAiC than during the Fram expedition (Figure 1). Fridjof Nansen would thus undoubtedly find the present-day Arctic Ocean a very different place.
Global warming and natural variability
Since 1979 and the start of reliable satellite measurements, the Arctic sea-ice cover has decreased in all seasons. This shows that the Arctic is transitioning from a fully ice-covered state, as Nansen experienced it, into a partially ice-free state. This transition is, however, not smooth and steady.
Instead, there are a lot of changes from year to year, and even periods where the sea-ice cover has been increasing for several years. These seemingly random variations are a result of internal climate variability. This variability is a major source of uncertainty in projections over the next decades, including the timing of a seasonally ice-free Arctic.
A new PhD thesis by Jakob Dörr from the University of Bergen and the Nansen Legacy project advances our understanding of the present and future atmospheric and oceanic drivers of winter sea-ice variability, and how internal variability has modified the observed changes in the summer and winter sea-ice cover.
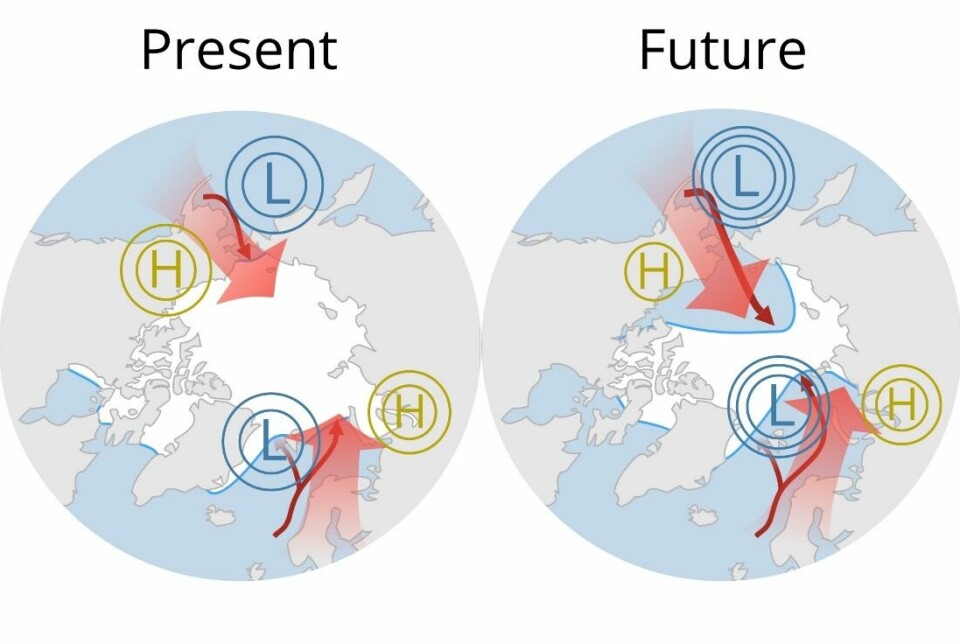
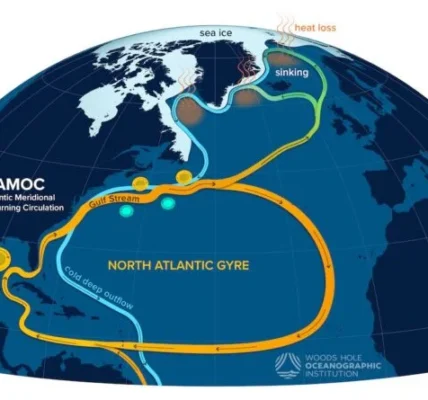
The thesis shows that inflow of warm waters from both the Atlantic Ocean and Pacific Ocean (Figure 2) impact the sea ice. As warm waters spread poleward in the future, this oceanic influence on sea ice will also expand. The poleward spreading of warm Atlantic and Pacific waters has been referred to as an ‘Atlantification’ and ‘Pacification’ of the Arctic, respectively.
The sea-ice cover is also affected by changes in atmospheric circulation and wind patterns (Figure 2). Winds can impact the sea ice directly by moving it around, and indirectly by transporting heat and moisture into the Arctic. The atmosphere can also communicate changes in other parts of the world to the Arctic through so-called teleconnections.
Dörr’s thesis shows that together, this internal oceanic and atmospheric variability can temporarily slow down or accelerate the sea-ice loss for up to several decades. For example, between 2000 and 2016, internal variability almost doubled the rate of winter sea-ice loss on the Atlantic side of the Arctic and led to an abnormally large sea-ice decrease on the Pacific side between 2010 and 2018. So what about this year’s winter?
Winter sea ice maximum in 2024
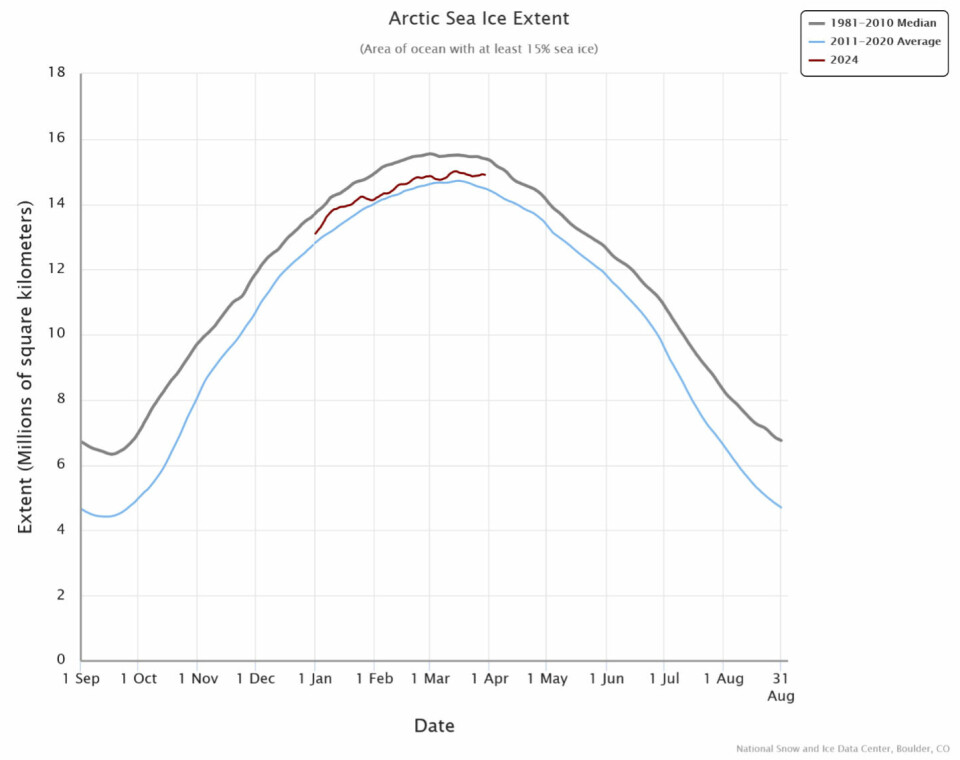
The sea-ice cover in the Arctic grows and melts in a seasonal cycle, reaching its highest extent in March, and its lowest extent in September (Figure 3). In winter, the sea ice covers an area of about 15 million square kilometers, roughly twice the size of Australia.
This year’s end-of-winter extent was reached on the 14th of March and was the fourteenth lowest in the satellite record maintained by the National Snow and Ice Data Center (Figure 3). The maximum winter sea ice extent in 2024 was about 640.000 square kilometers below the 1981-2010 average maximum, an area corresponding to twice the size of mainland Norway.
This year’s winter sea ice extent is, however, larger than what has been observed between 2011-2020, highlighting the influence of natural variability. Over longer time periods than a decade the impact of internal variability weakens, and the effect of climate change dominates, causing the gradual decline of the Arctic sea-ice cover observed in recent decades and projected for the future.
Jakob Dörr, POSTDOCTOR, GEOPHYSICAL INSTITUTE, UNIVERSITY OF BERGEN AND BJERKNES CENTRE FOR CLIMATE RESEARCH
Marius Årthun, RESEARCHER AT GEOPHYSICAL INSTITUTE, UNIVERSITY OF BERGEN AND RESEARCH LEADER, BJERKNES CENTRE FOR CLIMATE RESEARCH



What i do not realize is in fact how you are no longer actually much more wellfavored than you might be right now. You’re very intelligent. You recognize thus considerably in relation to this topic made me in my view believe it from numerous numerous angles. Your own stuffs excellent!
Thanks! I have just been looking for information about this subject for a long time and yours is the best. I’ve discovered till now.